WeightWatchers 2006 Annual Report Download - page 50
Download and view the complete annual report
Please find page 50 of the 2006 WeightWatchers annual report below. You can navigate through the pages in the report by either clicking on the pages listed below, or by using the keyword search tool below to find specific information within the annual report.-
 1
1 -
2
-
3
-
4
-
5
-
6
-
7
-
8
-
9
-
10
-
11
-
12
-
13
-
14
-
15
-
16
-
17
-
18
-
19
-
20
-
21
-
22
-
23
-
24
-
25
-
26
-
27
-
28
-
29
-
30
-
31
-
32
-
33
-
34
-
35
-
36
-
37
-
38
-
39
-
 40
40 -
 41
41 -
 42
42 -
 43
43 -
 44
44 -
 45
45 -
 46
46 -
 47
47 -
 48
48 -
 49
49 -
 50
50 -
 51
51 -
 52
52 -
 53
53 -
 54
54 -
 55
55 -
 56
56 -
 57
57 -
 58
58 -
 59
59 -
 60
60 -
61
-
62
-
63
-
64
-
65
-
66
-
67
-
68
-
69
-
70
-
71
-
72
-
73
-
74
-
75
-
76
-
77
-
78
-
79
-
80
-
81
-
82
-
83
-
84
-
85
-
86
-
87
-
88
-
89
-
90
-
91
-
92
-
93
-
94
-
95
-
96
-
97
-
98
-
99
-
100
-
101
-
102
-
103
-
104
-
105
-
106
-
107
-
108
-
109
-
110
-
111
-
112
 |
 |

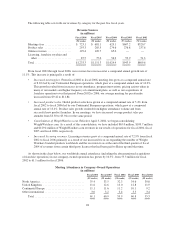
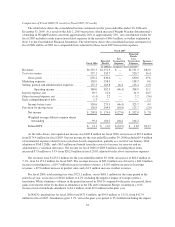
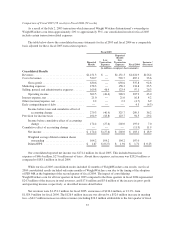
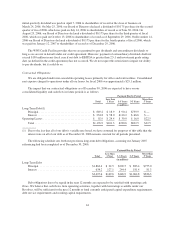
Comparison of Fiscal 2005 (52 weeks) to Fiscal 2004 (52 weeks)
As a result of the July 2, 2005 transaction which increased Weight Watchers International’s ownership in
WeightWatchers.com from approximately 20% to approximately 53%, our consolidated results for fiscal 2005
include certain transaction-related expenses.
The table below shows the consolidated income statements for fiscal 2005 and fiscal 2004 on a comparable
basis adjusted for these fiscal 2005 transaction expenses.
Fiscal 2005
Reported
Results
Less
Transaction
Expenses
Reported
Results
Less
Transaction
Expenses Fiscal 2004
Increase /
(Decrease)
(in millions, except per share amounts)
Consolidated Results
Revenues ................................... $1,151.3 $ — $1,151.3 $1,024.9 $126.4
Cost of revenues ............................. 520.7 — 520.7 487.1 33.6
Gross profit ............................. 630.6 — 630.6 537.8 92.8
Marketing expenses .......................... 158.3 — 158.3 134.8 23.5
Selling, general and administrative expenses ....... 169.8 46.4 123.4 97.1 26.3
Operating income ........................ 302.5 (46.4) 348.9 305.9 43.0
Interest expense, net .......................... 21.0 — 21.0 16.8 4.2
Other (income)/expense, net .................... 2.2 — 2.2 (4.7) 6.9
Early extinguishment of debt ................... — — — 4.3 (4.3)
Income before taxes and cumulative effect of
accounting change ..................... 279.3 (46.4) 325.7 289.5 36.2
Provision for income taxes ..................... 104.9 (18.8) 123.7 94.5 29.2
Income before cumulative effect of accounting
change ............................... 174.4 (27.6) 202.0 195.0 7.0
Cumulative effect of accounting change .......... — — — (11.9) 11.9
Net income ............................. $ 174.4 $ (27.6) $ 202.0 $ 183.1 $ 18.9
Weighted average diluted common shares
outstanding ........................... 104.2 104.2 104.2 107.0
Diluted EPS ............................ $ 1.67 $ (0.27) $ 1.94 $ 1.71 $ 0.23
Our consolidated reported net income was $174.4 million for fiscal 2005. This included transaction
expenses of $46.4 million, $27.6 million net of taxes. Absent these expenses, net income was $202.0 million as
compared to $183.1 million in fiscal 2004.
While our fiscal 2005 consolidated results included 12 months of WeightWatchers.com results, our fiscal
2004 consolidated results included only nine months of WeightWatchers.com due to the timing of the adoption
of FIN 46R at the beginning of the second quarter of fiscal 2004. The impact of consolidating
WeightWatchers.com for all four quarters in fiscal 2005 compared to the three quarters in fiscal 2004 represented
$24.3 million of the increase in total revenues, and $17.6 million and $5.6 million of the increase in gross profit
and operating income, respectively, as described in more detail below.
Net revenues were $1,151.3 million for fiscal 2005, an increase of $126.4 million, or 12.3%, from
$1,024.9 million for fiscal 2004. The $126.4 million increase was driven by a $52.0 million increase in meeting
fees, a $44.7 million increase in online revenues (including $26.3 million attributable to the first quarter of fiscal
37