WeightWatchers 2005 Annual Report Download - page 47
Download and view the complete annual report
Please find page 47 of the 2005 WeightWatchers annual report below. You can navigate through the pages in the report by either clicking on the pages listed below, or by using the keyword search tool below to find specific information within the annual report.-
 1
1 -
2
-
3
-
4
-
5
-
6
-
7
-
8
-
9
-
10
-
11
-
12
-
13
-
14
-
15
-
16
-
17
-
18
-
19
-
20
-
21
-
22
-
23
-
24
-
25
-
26
-
27
-
28
-
29
-
30
-
31
-
32
-
33
-
34
-
35
-
36
-
 37
37 -
 38
38 -
 39
39 -
 40
40 -
 41
41 -
 42
42 -
 43
43 -
 44
44 -
 45
45 -
 46
46 -
 47
47 -
 48
48 -
 49
49 -
 50
50 -
 51
51 -
 52
52 -
 53
53 -
 54
54 -
 55
55 -
 56
56 -
 57
57 -
58
-
59
-
60
-
61
-
62
-
63
-
64
-
65
-
66
-
67
-
68
-
69
-
70
-
71
-
72
-
73
-
74
-
75
-
76
-
77
-
78
-
79
-
80
-
81
-
82
-
83
-
84
-
85
-
86
-
87
-
88
-
89
-
90
-
91
-
92
-
93
-
94
-
95
-
96
-
97
-
98
-
99
-
100
-
101
-
102
-
103
-
104
-
105
-
106
-
107
-
108
-
109
-
110
-
111
-
112
-
113
-
114
-
115
-
116
-
117
-
118
-
119
-
120
-
121
-
122
-
123
-
124
-
125
-
126
-
127
-
128
 |
 |
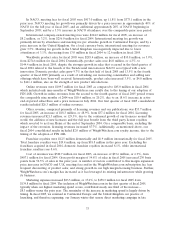
week in fiscal 2003 and any franchises that were acquired during either year. We made four franchise
acquisitions since the beginning of fiscal 2003: certain franchise territories of The WW Group at the
beginning of the second quarter of fiscal 2003, Dallas and New Mexico during the fourth quarter of
fiscal 2003, the Washington D.C. area during the second quarter of fiscal 2004 and Fort Worth during
the third quarter of fiscal 2004. The low-carb diet fad, which escalated over the course of fiscal 2003,
and was extended during fiscal 2004 by food manufacturers’ heavily marketed introductions of related
food products, had an impact on our North America business. We believe that the appeal of these
low-carb diets has peaked and the phenomenon is now in decline. The introduction of our TurnAround
program contributed to the improving attendance trends we saw in fiscal 2004. The declines in organic
attendances in fiscal 2004 versus fiscal 2003 improved from minus 16.7% in the second quarter to
minus 13.9% in the third quarter and minus 8.7% in the fourth quarter.
International company-owned meeting fees were $256.0 million for fiscal 2004, an increase of
$41.2 million, or 19.2%, from $214.8 million for fiscal 2003. The growth in meeting fees was primarily
driven by attendance increases in Continental Europe of 11.4% coupled with the favorable impact of
foreign currency exchange rates.
Product sales were $274.6 million for fiscal 2004, a decrease of $2.2 million from $276.8 million for
fiscal 2003. While total domestic product sales declined $19.8 million to $138.4 million in fiscal 2004
from $158.2 million in fiscal 2003, primarily driven by the attendance decline, internationally, product
sales increased 14.8% to $136.2 million. International product sales rose 2.7% on a local currency basis.
Franchise royalties were $12.5 million domestically and $6.3 million internationally in fiscal 2004.
Total franchise royalties of $18.8 million were down $6.1 million, or 24.5%, from $24.9 million in fiscal
2003. The decrease resulted from the impact of having acquired four franchises in the United States
since fiscal 2003 and from the general slowdown in the U.S. business. Excluding the recently acquired
franchises, domestic franchise royalties declined 17.1%, while international franchise royalties rose
1.0%.
Revenue from advertising, licensing and other sources was $43.6 million for fiscal 2004, an increase
of $8.6 million, or 24.6%, from $35.0 million for fiscal 2003. Licensing revenue increased $7.0 million,
up 72.2% over fiscal 2003, due to our continued focus on introducing a range of Weight Watchers
branded products worldwide. Revenues from advertising, our WeightWatchers.com licensee and other
sources contributed to the remainder of the increase.
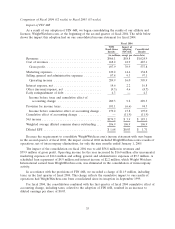
Cost of revenues was $468.2 million for fiscal 2004, an increase of $27.8 million, or 6.3%, from
$440.4 million for fiscal 2003. For fiscal 2004, the gross profit margin of 51.5% remained above the
50% level, but was lower than the 53.3% level of fiscal 2003. We made the strategic decision to keep
the vast majority of our NACO meetings open, despite the negative impact on our gross margin
resulting from lower attendances per meeting due to our expectation of the decline in the low-carb
phenomenon. We believe this expectation has proven to be correct.
Marketing expenses increased $6.6 million, or 5.8%, to $120.2 million for fiscal 2004 from
$113.6 million in fiscal 2003, with the majority of the increase resulting from currency translation. As a
percentage of net revenue, marketing expenses were 12.4% for fiscal 2004, as compared to 12.0% in
fiscal 2003, driven by the softness in revenues.
Selling, general and administrative expenses were $87.8 million for fiscal 2004, an increase of
$14.0 million, or 19.0%, from $73.8 million in fiscal 2003. Expenses were driven up by professional fees
and expenses related to compliance with Sarbanes-Oxley, as well as by a strengthening of our
management team and increase in our headcount to drive the future growth of our business. Selling,
general and administrative expenses were 9.1% of revenues for fiscal 2004, as compared to 7.8% in
fiscal 2003.
37