WeightWatchers 2005 Annual Report Download - page 37
Download and view the complete annual report
Please find page 37 of the 2005 WeightWatchers annual report below. You can navigate through the pages in the report by either clicking on the pages listed below, or by using the keyword search tool below to find specific information within the annual report.-
 1
1 -
2
-
3
-
4
-
5
-
6
-
7
-
8
-
9
-
10
-
11
-
12
-
13
-
14
-
15
-
16
-
17
-
18
-
19
-
20
-
21
-
22
-
23
-
24
-
25
-
26
-
 27
27 -
 28
28 -
 29
29 -
 30
30 -
 31
31 -
 32
32 -
 33
33 -
 34
34 -
 35
35 -
 36
36 -
 37
37 -
 38
38 -
 39
39 -
 40
40 -
 41
41 -
 42
42 -
 43
43 -
 44
44 -
 45
45 -
 46
46 -
 47
47 -
48
-
49
-
50
-
51
-
52
-
53
-
54
-
55
-
56
-
57
-
58
-
59
-
60
-
61
-
62
-
63
-
64
-
65
-
66
-
67
-
68
-
69
-
70
-
71
-
72
-
73
-
74
-
75
-
76
-
77
-
78
-
79
-
80
-
81
-
82
-
83
-
84
-
85
-
86
-
87
-
88
-
89
-
90
-
91
-
92
-
93
-
94
-
95
-
96
-
97
-
98
-
99
-
100
-
101
-
102
-
103
-
104
-
105
-
106
-
107
-
108
-
109
-
110
-
111
-
112
-
113
-
114
-
115
-
116
-
117
-
118
-
119
-
120
-
121
-
122
-
123
-
124
-
125
-
126
-
127
-
128
 |
 |

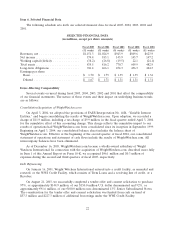
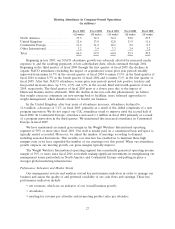
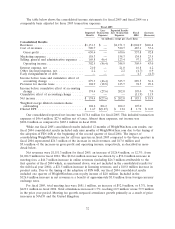
Meeting Attendance in Company-Owned Operations
(in millions)
Fiscal 2005 Fiscal 2004 Fiscal 2003 Fiscal 2002 Fiscal 2001
(52 weeks) (52 weeks) (53 weeks) (52 weeks) (52 weeks)
North America ................ 33.5 32.3 34.6 30.8 23.5
United Kingdom ............... 12.6 13.0 12.8 11.9 11.6
Continental Europe ............. 11.6 11.2 10.1 9.2 8.7
Other International ............. 3.2 3.4 3.3 3.4 3.2
Total ....................... 60.9 59.9 60.8 55.3 47.0
Beginning in late 2003, our NACO attendance growth was adversely affected by increased media
exposure to and the resulting popularity of low-carbohydrate diets, which continued through 2004.
Beginning in the third quarter of fiscal 2004 through the first quarter of fiscal 2005, the declines in
organic NACO attendance (excluding the impact of acquisitions) versus prior year periods steadily
improved from minus 16.7% in the second quarter of fiscal 2004 to minus 13.9% in the third quarter of
fiscal 2004 to minus 8.7% in the fourth quarter of fiscal 2004 and to minus 5.1% in the first quarter of
fiscal 2005. After that, NACO attendance versus prior year periods moved into positive territory and
has posted increases since, up 5.3%, 2.5% and 6.5% in the second, third and fourth quarters of fiscal
2005, respectively. The third quarter of fiscal 2005 grew at a slower pace due to the impact of
Hurricane Katrina and its aftermath. With the decline in the low-carb diet phenomenon, we believe
that weight conscious consumers are now moving back to healthier, more balanced approaches to
weight management, which should continue to benefit our business.
In the United Kingdom, after four years of attendance increases, attendance declined to
12.6 million, a decrease of 3.1%, in fiscal 2005, primarily as a result of the added complexity of a new
program innovation. We do not expect our U.K. attendance trend to improve until the second half of
fiscal 2006. In Continental Europe, attendance increased 1.1 million in fiscal 2004 primarily as a result
of a program innovation in the third quarter. We maintained this increased attendance in Continental
Europe in fiscal 2005.
We have maintained an annual gross margin in the Weight Watchers International operating
segment of 50% or more since fiscal 2001. Our staff is usually paid on a commission basis and space is
typically rented as needed. Moreover, we adjust the number of meetings according to demand,
including seasonal fluctuations. This variable cost structure has enabled us to maintain these high
margins even as we have expanded the number of our meetings over this period. When our attendance
growth outpaces our meeting growth, our gross margins typically improve.
The Weight Watchers International operating segment has consistently generated operating income
margin of 30% or more since fiscal 2001 even while making significant investments in strengthening our
management teams particularly in North America and Continental Europe and putting in place a
stronger global marketing infrastructure.
Performance Indicators and Market Trends
Our management reviews and analyzes several key performance indicators in order to manage our
business and assess the quality of and potential variability of our cash flows and earnings. These key
performance indicators include:
• net revenues, which are an indicator of our overall business growth;
• attendance;
• meeting fee revenue per attendee and in-meeting product sales per attendee;
27