WeightWatchers 2005 Annual Report Download - page 46
Download and view the complete annual report
Please find page 46 of the 2005 WeightWatchers annual report below. You can navigate through the pages in the report by either clicking on the pages listed below, or by using the keyword search tool below to find specific information within the annual report.-
 1
1 -
2
-
3
-
4
-
5
-
6
-
7
-
8
-
9
-
10
-
11
-
12
-
13
-
14
-
15
-
16
-
17
-
18
-
19
-
20
-
21
-
22
-
23
-
24
-
25
-
26
-
27
-
28
-
29
-
30
-
31
-
32
-
33
-
34
-
35
-
 36
36 -
 37
37 -
 38
38 -
 39
39 -
 40
40 -
 41
41 -
 42
42 -
 43
43 -
 44
44 -
 45
45 -
 46
46 -
 47
47 -
 48
48 -
 49
49 -
 50
50 -
 51
51 -
 52
52 -
 53
53 -
 54
54 -
 55
55 -
 56
56 -
57
-
58
-
59
-
60
-
61
-
62
-
63
-
64
-
65
-
66
-
67
-
68
-
69
-
70
-
71
-
72
-
73
-
74
-
75
-
76
-
77
-
78
-
79
-
80
-
81
-
82
-
83
-
84
-
85
-
86
-
87
-
88
-
89
-
90
-
91
-
92
-
93
-
94
-
95
-
96
-
97
-
98
-
99
-
100
-
101
-
102
-
103
-
104
-
105
-
106
-
107
-
108
-
109
-
110
-
111
-
112
-
113
-
114
-
115
-
116
-
117
-
118
-
119
-
120
-
121
-
122
-
123
-
124
-
125
-
126
-
127
-
128
 |
 |

Weight Watchers International on a Stand-Alone Basis
The remaining sections of this discussion will address only the results of Weight Watchers
International and its majority-owned subsidiaries and will exclude the impact of FIN 46R and the
consolidation of WeightWatchers.com.
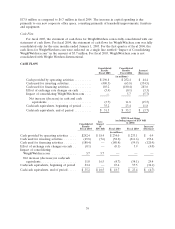
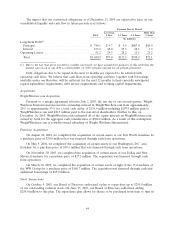
The chart below compares Weight Watchers International’s fiscal 2004 results to the prior year
comparable period:
Weight Watchers International
Increase/
Fiscal 2004 Fiscal 2003 (Decrease)
(in millions, except per share data)
Revenues .................................... $966.1 $943.9 $22.2
Cost of revenues ............................... 468.2 440.4 27.8
Gross profit ................................. 497.9 503.5 (5.6)
Marketing expenses ............................. 120.2 113.6 6.6
Selling, general and administrative expenses ........... 87.8 73.8 14.0
Operating income ............................ 289.9 316.1 (26.2)
Interest expense, net ............................ 14.6 33.7 (19.1)
Other (income)/expense, net ...................... (9.3) 2.8 (12.1)
Early extinguishment of debt ...................... 4.3 47.4 (43.1)
Income before taxes ........................... 280.3 232.2 48.1
Provision for income taxes ........................ 101.1 88.3 12.8
Net income ................................... $179.2 $143.9 $35.3
Diluted EPS .................................. $ 1.68 $ 1.31 $0.37
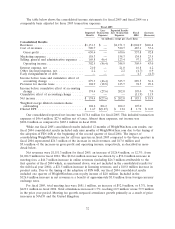
Net income for fiscal 2004 was $179.2 million, up from $143.9 million in fiscal 2003. Diluted
earnings per share were $1.68 in fiscal 2004 as compared to $1.31 in fiscal 2003. Excluding the impact
of the early extinguishment of debt in both years, diluted earnings per share were $1.70 in fiscal 2004
compared to $1.59 in fiscal 2003. Fiscal 2003 included a 53rd week versus only 52 weeks in fiscal 2004.
Accordingly, our reported results are not fully comparable for the two years.
Net revenues were $966.1 million for fiscal 2004, an increase of $22.2 million, or 2.4%, from
$943.9 million for fiscal 2003. The 2.4% increase in net revenues was driven by international attendance
growth and more favorable foreign currency rates, partially offset by a decline in North America
attendance. On a worldwide basis, attendance at company-owned meetings declined 1.5%. Compared to
the fiscal 2003, meeting fees increased $21.9 million, licensing revenues rose $7.0 million, advertising
revenue increased $2.4 million, and we earned an additional $1.1 million of royalties from our licensee,
WeightWatchers.com. Franchise commissions were $6.1 million lower than in fiscal 2003 as we
continued our franchise acquisition program, adding two more in fiscal 2004. Product sales declined
$2.2 million, as did publishing and other revenue by $1.9 million. Included in the total $22.2 million
increase in net revenues was a benefit of approximately $42.5 million from foreign currency exchange
rates. On a local currency basis, meeting fees and product sales in our international operations
increased 5.4%.
For fiscal 2004, total meeting fees were $629.1 million, an increase of $21.9 million, or 3.6%, from
$607.2 million in the prior year. Attendances declined slightly to 59.9 million from 60.8 million in fiscal
2003. In NACO, meeting fees were $373.1 million for fiscal 2004, down 4.9% from $392.4 million in
fiscal 2003. Including acquisitions, NACO attendance for the year was 6.5% lower than fiscal 2003.
NACO organic attendance declined 12.1%. The organic attendance comparison excludes the additional
36