WeightWatchers 2005 Annual Report Download - page 110
Download and view the complete annual report
Please find page 110 of the 2005 WeightWatchers annual report below. You can navigate through the pages in the report by either clicking on the pages listed below, or by using the keyword search tool below to find specific information within the annual report.-
 1
1 -
2
-
3
-
4
-
5
-
6
-
7
-
8
-
9
-
10
-
11
-
12
-
13
-
14
-
15
-
16
-
17
-
18
-
19
-
20
-
21
-
22
-
23
-
24
-
25
-
26
-
27
-
28
-
29
-
30
-
31
-
32
-
33
-
34
-
35
-
36
-
37
-
38
-
39
-
40
-
41
-
42
-
43
-
44
-
45
-
46
-
47
-
48
-
49
-
50
-
51
-
52
-
53
-
54
-
55
-
56
-
57
-
58
-
59
-
60
-
61
-
62
-
63
-
64
-
65
-
66
-
67
-
68
-
69
-
70
-
71
-
72
-
73
-
74
-
75
-
76
-
77
-
78
-
79
-
80
-
81
-
82
-
83
-
84
-
85
-
86
-
87
-
88
-
89
-
90
-
91
-
92
-
93
-
94
-
95
-
96
-
97
-
98
-
99
-
 100
100 -
 101
101 -
 102
102 -
 103
103 -
 104
104 -
 105
105 -
 106
106 -
 107
107 -
 108
108 -
 109
109 -
 110
110 -
 111
111 -
 112
112 -
 113
113 -
 114
114 -
 115
115 -
 116
116 -
 117
117 -
 118
118 -
 119
119 -
 120
120 -
121
-
122
-
123
-
124
-
125
-
126
-
127
-
128
 |
 |

WEIGHT WATCHERS INTERNATIONAL, INC. AND SUBSIDIARIES
NOTES TO CONSOLIDATED FINANCIAL STATEMENTS (Continued)
(IN THOUSANDS, EXCEPT PER SHARE AMOUNTS)
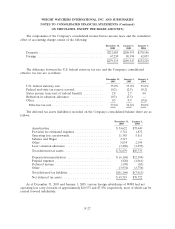
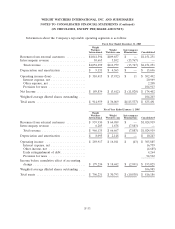
The following table presents information about the Company’s sources of revenue and other
information by geographic area. There were no material amounts of sales or transfers among
geographic areas and no material amounts of United States export sales.
Revenues for the Fiscal Year Ended
December 31, January 1, January 3,
2005 2005 2004
NACO meeting fees ........................... $ 416,952 $ 373,119 $392,432
International company-owned meeting fees .......... 264,145 255,978 214,772
Product sales ................................ 285,448 274,640 276,835
Franchise royalties ............................ 19,393 18,789 24,879
Online revenues .............................. 109,657 64,989 —
Other ..................................... 55,656 37,404 35,014
$1,151,251 $1,024,919 $943,932
Revenues for the Fiscal Year Ended
December 31, January 1, January 3,
2005 2005 2004
United States ................................ $ 699,981 $ 606,916 $599,944
United Kingdom ............................. 169,168 163,338 140,886
Continental Europe ........................... 219,175 196,953 159,155
Australia, New Zealand and other ................. 62,927 57,712 43,947
$1,151,251 $1,024,919 $943,932
Long-Lived Assets
December 31, January 1, January 3,
2005 2005 2004
United States ................................. $ 603,356 $572,012 $506,004
United Kingdom ............................... 2,342 2,383 2,653
Continental Europe ............................ 4,589 3,376 3,153
Australia, New Zealand and other .................. 26,234 27,676 26,431
$ 636,521 $605,447 $538,241
16. Financial Instruments
Fair Value of Financial Instruments:
The Company’s significant financial instruments include cash and cash equivalents, short and
long-term debt, and interest rate swap agreements.
In evaluating the fair value of significant financial instruments, the Company generally uses quoted
market prices of the same or similar instruments or calculates an estimated fair value on a discounted
cash flow basis using the rates available for instruments with the same remaining maturities. As of
December 31, 2005, the fair value of financial instruments held by the Company approximated the
recorded value.
F-34