WeightWatchers 2003 Annual Report Download - page 83
Download and view the complete annual report
Please find page 83 of the 2003 WeightWatchers annual report below. You can navigate through the pages in the report by either clicking on the pages listed below, or by using the keyword search tool below to find specific information within the annual report.-
 1
1 -
2
-
3
-
4
-
5
-
6
-
7
-
8
-
9
-
10
-
11
-
12
-
13
-
14
-
15
-
16
-
17
-
18
-
19
-
20
-
21
-
22
-
23
-
24
-
25
-
26
-
27
-
28
-
29
-
30
-
31
-
32
-
33
-
34
-
35
-
36
-
37
-
38
-
39
-
40
-
41
-
42
-
43
-
44
-
45
-
46
-
47
-
48
-
49
-
50
-
51
-
52
-
53
-
54
-
55
-
56
-
57
-
58
-
59
-
60
-
61
-
62
-
63
-
64
-
65
-
66
-
67
-
68
-
69
-
70
-
71
-
72
-
 73
73 -
 74
74 -
 75
75 -
 76
76 -
 77
77 -
 78
78 -
 79
79 -
 80
80 -
 81
81 -
 82
82 -
 83
83 -
 84
84 -
 85
85 -
 86
86 -
 87
87 -
 88
88 -
 89
89 -
 90
90 -
 91
91 -
 92
92 -
 93
93 -
94
-
95
-
96
-
97
-
98
-
99
-
100
-
101
-
102
-
103
-
104
-
105
-
106
-
107
-
108
-
109
-
110
-
111
-
112
 |
 |

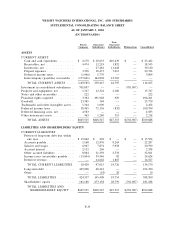
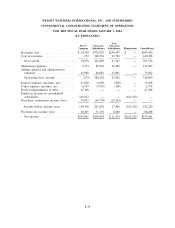
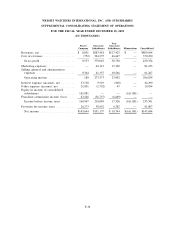
WEIGHT WATCHERS INTERNATIONAL, INC. AND SUBSIDIARIES
NOTES TO CONSOLIDATED FINANCIAL STATEMENTS (Continued)
(IN THOUSANDS, EXCEPT PER SHARE AMOUNTS)
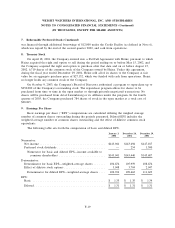
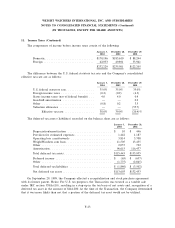
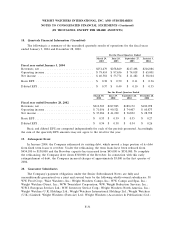
16. Segment and Geographic Data (Continued)
geographic area. There were no material amounts of sales or transfers among geographic areas and no
material amounts of United States export sales.
Revenues
January 3, December 28, December 29,
2004 2002 2001
NACO meeting fees ................................. $392,432 $350,683 $262,467
International company-owned meeting fees ................ 214,772 170,043 153,213
Product sales ...................................... 276,835 237,602 170,363
Franchise royalties .................................. 24,879 31,347 28,371
Other ............................................ 35,014 19,969 9,456
$943,932 $809,644 $623,870
Revenues
January 3, December 28, December 29,
2004 2002 2001
United States ...................................... $599,944 $542,885 $397,434
United Kingdom .................................... 140,886 112,750 97,594
Continental Europe ................................. 159,155 117,425 97,421
Australia, New Zealand and other ....................... 43,947 36,584 31,421
$943,932 $809,644 $623,870
Long-Lived Assets
January 3, December 28, December 29,
2004 2002 2001
United States ...................................... $506,004 $299,349 $230,696
United Kingdom .................................... 2,653 2,854 2,909
Continental Europe ................................. 3,153 2,537 2,025
Australia, New Zealand and other ....................... 26,431 18,302 16,260
$538,241 $323,042 $251,890
17. Financial Instruments
Fair Value of Financial Instruments:
The Company’s significant financial instruments include cash and cash equivalents, short and
long-term debt, current and noncurrent notes receivable, currency exchange agreements and guarantees.
In evaluating the fair value of significant financial instruments, the Company generally uses quoted
market prices of the same or similar instruments or calculates an estimated fair value on a discounted
cash flow basis using the rates available for instruments with the same remaining maturities. As of
January 3, 2004, the fair value of financial instruments held by the Company, excluding the 13% Senior
Subordinated Notes due 2009, approximated the recorded value. Based on current interest rates,
management believes that the carrying amount at January 3, 2004 of the Company’s 13% Senior
Subordinated Notes due 2009 of $15,694 has an estimated fair value of $18,775.
F-29