WeightWatchers 2003 Annual Report Download - page 29
Download and view the complete annual report
Please find page 29 of the 2003 WeightWatchers annual report below. You can navigate through the pages in the report by either clicking on the pages listed below, or by using the keyword search tool below to find specific information within the annual report.-
 1
1 -
2
-
3
-
4
-
5
-
6
-
7
-
8
-
9
-
10
-
11
-
12
-
13
-
14
-
15
-
16
-
17
-
18
-
 19
19 -
 20
20 -
 21
21 -
 22
22 -
 23
23 -
 24
24 -
 25
25 -
 26
26 -
 27
27 -
 28
28 -
 29
29 -
 30
30 -
 31
31 -
 32
32 -
 33
33 -
 34
34 -
 35
35 -
 36
36 -
 37
37 -
 38
38 -
 39
39 -
40
-
41
-
42
-
43
-
44
-
45
-
46
-
47
-
48
-
49
-
50
-
51
-
52
-
53
-
54
-
55
-
56
-
57
-
58
-
59
-
60
-
61
-
62
-
63
-
64
-
65
-
66
-
67
-
68
-
69
-
70
-
71
-
72
-
73
-
74
-
75
-
76
-
77
-
78
-
79
-
80
-
81
-
82
-
83
-
84
-
85
-
86
-
87
-
88
-
89
-
90
-
91
-
92
-
93
-
94
-
95
-
96
-
97
-
98
-
99
-
100
-
101
-
102
-
103
-
104
-
105
-
106
-
107
-
108
-
109
-
110
-
111
-
112
 |
 |

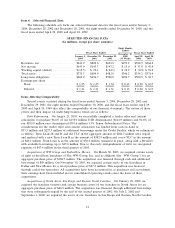
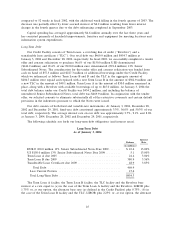
more robust in the second half of 2002, up 9.3% over 2001 levels, partially as a result of a program
innovation in Continental Europe. International member attendances increased 4.3% overall.
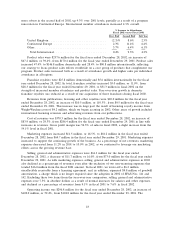
% Increase in Attendances
Fiscal 2002 versus Fiscal 2001
First Half Second Half Full Year
United Kingdom ................................. (2.3)% 8.6% 2.3%
Continental Europe .............................. 2.3% 11.4% 6.4%
Other ......................................... 5.7% 6.4% 6.1%
Total International .............................. 0.4% 9.3% 4.3%
Product sales were $237.6 million for the fiscal year ended December 28, 2002, an increase of
$67.2 million, or 39.4%, from $170.4 million for the fiscal year ended December 29, 2001. Product sales
increased 47.4% to $146.8 million domestically and 28.4% to $90.8 million internationally, reflecting
our strategy to focus product sales efforts worldwide on a core group of products that complement our
program. Product sales increased both as a result of attendance growth and higher sales per individual
attendance in all regions.
Franchise royalties were $25.8 million domestically and $5.6 million internationally for the fiscal
year ended December 28, 2002. In total, franchise royalties increased $3.0 million, or 11.0%, from
$28.3 million for the fiscal year ended December 29, 2001, to $31.3 million in fiscal 2002 on the
strength of increased member attendance and product sales. Year-over-year growth in domestic
franchise royalties was reduced as a result of our acquisition of three franchises during fiscal 2002.
Revenues from publications, licensing and other royalties were $20.0 million for the fiscal year
ended December 28, 2002, an increase of $10.5 million, or 110.5%, from $9.5 million for the fiscal year
ended December 29, 2001. This increase was in large part the result of licensing royalty income from
WeightWatchers.com of $4.2 million, which we began accruing in 2002. Other areas of growth included
international licensing revenues and advertising revenues from our publications.
Cost of revenues was $370.3 million for the fiscal year ended December 28, 2002, an increase of
$83.9 million, or 29.3%, from $286.4 million for the fiscal year ended December 29, 2001 in line with
increases in revenues. Gross profit margin was 54.3% of sales in fiscal 2002, a slight increase from the
54.1% level in fiscal 2001.
Marketing expenses increased $11.5 million, or 16.5%, to $81.2 million in the fiscal year ended
December 28, 2002 from $69.7 million in the fiscal year ended December 29, 2001. Marketing expenses
increased to support the continuing growth of the business. As a percentage of net revenues, marketing
expenses decreased from 11.2% in 2001 to 10.0% in 2002, as we continued to leverage our marketing
efforts across the growing revenue base.
Selling, general and administrative expenses were $61.3 million for the fiscal year ended
December 28, 2002, a decrease of $11.7 million, or 16.0%, from $73.0 million for the fiscal year ended
December 29, 2001. As with marketing expenses, selling, general and administrative expenses in 2002
also declined as a percentage of revenues even after the exclusion of two non-recurring expenses that
totaled $16.0 million from the fiscal 2001 amount. In fiscal 2001, we wrote-off a $6.2 million
uncollectible receivable from a licensing agreement, and, in addition, expensed $9.8 million of goodwill
amortization, a charge which is no longer required since the adoption in 2002 of SFAS Nos. 141 and
142. Excluding these two items from the year-over-year comparison, selling, general and administrative
expenses rose 7.5% in absolute dollars as a result of normal increases for salaries and other expenses,
and declined as a percentage of revenues from 9.1% in fiscal 2001 to 7.6% in fiscal 2002.
Operating income was $296.8 million for the fiscal year ended December 28, 2002, an increase of
$102.0 million, or 52.4%, from $194.8 million for the fiscal year ended December 29, 2001. The
23