WeightWatchers 2003 Annual Report Download - page 25
Download and view the complete annual report
Please find page 25 of the 2003 WeightWatchers annual report below. You can navigate through the pages in the report by either clicking on the pages listed below, or by using the keyword search tool below to find specific information within the annual report.-
 1
1 -
2
-
3
-
4
-
5
-
6
-
7
-
8
-
9
-
10
-
11
-
12
-
13
-
14
-
 15
15 -
 16
16 -
 17
17 -
 18
18 -
 19
19 -
 20
20 -
 21
21 -
 22
22 -
 23
23 -
 24
24 -
 25
25 -
 26
26 -
 27
27 -
 28
28 -
 29
29 -
 30
30 -
 31
31 -
 32
32 -
 33
33 -
 34
34 -
 35
35 -
36
-
37
-
38
-
39
-
40
-
41
-
42
-
43
-
44
-
45
-
46
-
47
-
48
-
49
-
50
-
51
-
52
-
53
-
54
-
55
-
56
-
57
-
58
-
59
-
60
-
61
-
62
-
63
-
64
-
65
-
66
-
67
-
68
-
69
-
70
-
71
-
72
-
73
-
74
-
75
-
76
-
77
-
78
-
79
-
80
-
81
-
82
-
83
-
84
-
85
-
86
-
87
-
88
-
89
-
90
-
91
-
92
-
93
-
94
-
95
-
96
-
97
-
98
-
99
-
100
-
101
-
102
-
103
-
104
-
105
-
106
-
107
-
108
-
109
-
110
-
111
-
112
 |
 |

adjustments for qualifying derivative instruments are recorded as a component of other comprehensive
income and will be included in earnings in the periods in which earnings are affected by the hedged
item. Fair value adjustments for non-qualifying derivative instruments are recorded in our results of
operations.
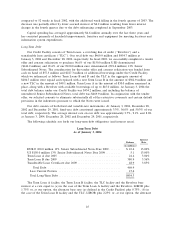
WeightWatchers.com
We own approximately 19.9% of our affiliate and licensee, WeightWatchers.com, or approximately
37% on a fully diluted basis (including the exercise of all options and all the warrants we own in
WeightWatchers.com). Because of our ability to exercise significant influence over WeightWatchers.com,
we account for this investment under the equity method of accounting. Under a loan agreement
between us and WeightWatchers.com, we advanced WeightWatchers.com $34.5 million. In 2001, we
wrote off our loans to the extent of our equity interest in WeightWatchers.com’s losses. In addition, in
2001, we fully reserved for the remaining loan balance. In 2003, we received a $5.0 million payment
from WeightWatchers.com reducing the principal balance to $29.5 million.
Income Taxes
Deferred income taxes result primarily from temporary differences between financial and tax
reporting. If it is more likely than not that some portion of a deferred tax asset will not be realized, a
valuation allowance is recognized. We consider historic levels of income, estimates of future taxable
income and feasible tax planning strategies in assessing the need for a tax valuation allowance.
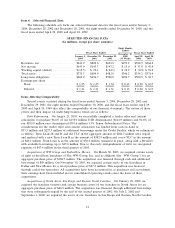
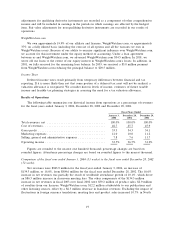
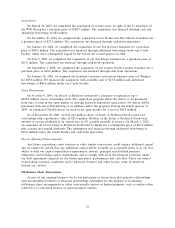
Results of Operations
The following table summarizes our historical income from operations as a percentage of revenues
for the fiscal years ended January 3, 2004, December 28, 2002 and December 29, 2001.
Fiscal Years Ended
January 3, December 28, December 29,
2004 2002 2001
Total revenues, net .................................. 100.0% 100.0% 100.0%
Cost of revenues .................................... 46.7 45.7 45.9
Gross profit ....................................... 53.3 54.3 54.1
Marketing expenses .................................. 12.0 10.0 11.2
Selling, general and administrative expenses ................ 7.8 7.6 11.7
Operating income ................................... 33.5% 36.7% 31.2%
Figures are rounded to the nearest one hundred thousand; percentage changes are based on
rounded figures. Attendance percentage changes are based on rounded figures to the nearest thousand.
Comparison of the fiscal year ended January 3, 2004 (53 weeks) to the fiscal year ended December 28, 2002
(52 weeks).
Net revenues were $943.9 million for the fiscal year ended January 3, 2004, an increase of
$134.3 million, or 16.6%, from $809.6 million for the fiscal year ended December 28, 2002. The 16.6%
increase in net revenues was partially the result of worldwide attendance growth of 10.1%, which drove
an $86.5 million increase in classroom meeting fees. The other components of the $134.3 million
increase in net revenues in fiscal 2003 over fiscal 2002 were $39.2 million of product sales, $2.9 million
of royalties from our licensee, WeightWatchers.com, $12.2 million attributable to our publications and
other licensing sources, offset by a $6.5 million decrease in franchise revenues. Excluding the impact of
fluctuations in foreign currency translations, meeting fees and product sales increased 10.7% in North
19