WeightWatchers 2003 Annual Report Download - page 22
Download and view the complete annual report
Please find page 22 of the 2003 WeightWatchers annual report below. You can navigate through the pages in the report by either clicking on the pages listed below, or by using the keyword search tool below to find specific information within the annual report.-
 1
1 -
2
-
3
-
4
-
5
-
6
-
7
-
8
-
9
-
10
-
11
-
 12
12 -
 13
13 -
 14
14 -
 15
15 -
 16
16 -
 17
17 -
 18
18 -
 19
19 -
 20
20 -
 21
21 -
 22
22 -
 23
23 -
 24
24 -
 25
25 -
 26
26 -
 27
27 -
 28
28 -
 29
29 -
 30
30 -
 31
31 -
 32
32 -
33
-
34
-
35
-
36
-
37
-
38
-
39
-
40
-
41
-
42
-
43
-
44
-
45
-
46
-
47
-
48
-
49
-
50
-
51
-
52
-
53
-
54
-
55
-
56
-
57
-
58
-
59
-
60
-
61
-
62
-
63
-
64
-
65
-
66
-
67
-
68
-
69
-
70
-
71
-
72
-
73
-
74
-
75
-
76
-
77
-
78
-
79
-
80
-
81
-
82
-
83
-
84
-
85
-
86
-
87
-
88
-
89
-
90
-
91
-
92
-
93
-
94
-
95
-
96
-
97
-
98
-
99
-
100
-
101
-
102
-
103
-
104
-
105
-
106
-
107
-
108
-
109
-
110
-
111
-
112
 |
 |

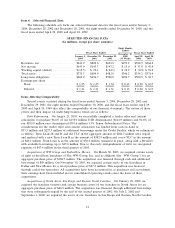
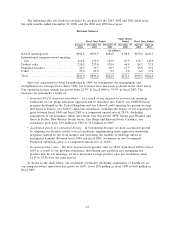
The following table sets forth our revenues by category for the 2003, 2002 and 2001 fiscal years,
the eight months ended December 30, 2000, and the 2000 and 1999 fiscal years.
Revenue Sources
Eight Months
Fiscal Years Ended Ended Fiscal Years Ended
January 3, December 28, December 29, December 30, April 29, April 24,
2004 2002 2001 2000 2000 1999
(In millions)
NACO meetings fees .............. $392.4 $350.7 $262.5 $ 96.8 $130.8 $122.3
International company-owned meeting
fees ......................... 214.8 170.0 153.2 87.3 152.7 143.9
Product sales .................... 276.8 237.6 170.4 66.4 84.2 57.3
Franchise royalties ................ 24.9 31.3 28.3 17.7 25.8 23.2
Other ......................... 35.0 20.0 9.5 5.0 6.0 17.9
Total .......................... $943.9 $809.6 $623.9 $273.2 $399.5 $364.6
After our acquisition by Artal Luxembourg in 1999, we reorganized our management and
strengthened our strategic focus. Since 1999, our revenues have increased as shown in the chart above.
Our operating income margin has grown from 22.3% in fiscal 1999 to 33.5% in fiscal 2003. The
increases are principally a result of:
•Increased NACO classroom attendance. As a result of our decision to re-focus our meetings
exclusively on our group education approach and to introduce into NACO our POINTS-based
program developed in the United Kingdom and our Liberty/Loyalty meeting fee pricing strategy
developed in France, our NACO classroom attendance, including the impact of our acquisitions,
grew between fiscal 1999 and fiscal 2003 at a compound annual rate of 28.1%. Including
acquisitions of our franchises which were made over this period (WW Group and Weighco and
those in Dallas, New Mexico, North Jersey, San Diego and Eastern North Carolina), our
attendance grew from 10.9 million in 1999 to 34.6 million in 2003.
•Accelerated growth in Continental Europe. In Continental Europe, we have accelerated growth
by adapting our business model to local conditions, implementing more aggressive marketing
programs tailored to the local markets and increasing the number of meetings ahead of
anticipated demand. Between fiscal 1999 and fiscal 2003, attendance in our Continental
European operations grew at a compound annual rate of 12.8%.
•Increased product sales. We have increased our product sales by 383% from fiscal 1999 to fiscal
2003 as a result of our growing attendance, introducing new products and optimizing our
product mix. In our meetings, we have increased average product sales per attendance from
$1.53 to $3.56 over the same period.
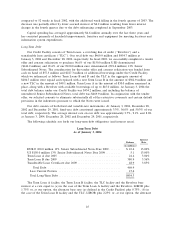
As shown in the chart below, our worldwide attendance (including acquisitions of franchises) in
our company-owned operations has grown by 104%, from 29.8 million in fiscal 1999 to 60.8 million in
fiscal 2003.
16