WeightWatchers 2003 Annual Report Download - page 27
Download and view the complete annual report
Please find page 27 of the 2003 WeightWatchers annual report below. You can navigate through the pages in the report by either clicking on the pages listed below, or by using the keyword search tool below to find specific information within the annual report.-
 1
1 -
2
-
3
-
4
-
5
-
6
-
7
-
8
-
9
-
10
-
11
-
12
-
13
-
14
-
15
-
16
-
 17
17 -
 18
18 -
 19
19 -
 20
20 -
 21
21 -
 22
22 -
 23
23 -
 24
24 -
 25
25 -
 26
26 -
 27
27 -
 28
28 -
 29
29 -
 30
30 -
 31
31 -
 32
32 -
 33
33 -
 34
34 -
 35
35 -
 36
36 -
 37
37 -
38
-
39
-
40
-
41
-
42
-
43
-
44
-
45
-
46
-
47
-
48
-
49
-
50
-
51
-
52
-
53
-
54
-
55
-
56
-
57
-
58
-
59
-
60
-
61
-
62
-
63
-
64
-
65
-
66
-
67
-
68
-
69
-
70
-
71
-
72
-
73
-
74
-
75
-
76
-
77
-
78
-
79
-
80
-
81
-
82
-
83
-
84
-
85
-
86
-
87
-
88
-
89
-
90
-
91
-
92
-
93
-
94
-
95
-
96
-
97
-
98
-
99
-
100
-
101
-
102
-
103
-
104
-
105
-
106
-
107
-
108
-
109
-
110
-
111
-
112
 |
 |

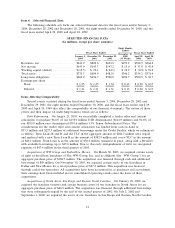
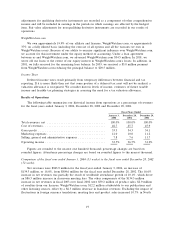
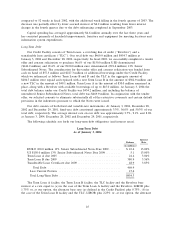
The following chart shows the change in gross profit margin for each quarter of the last two fiscal
years:
Fiscal Year 2003
First Second Third Fourth Full
Quarter Quarter Quarter Quarter Year
(in millions)
Revenues, net ................... $251.5 $258.8 $217.5 $216.1 $943.9
Cost of revenues ................. 113.3 116.1 107.3 103.7 440.4
Gross profit ($) .................. $138.2 $142.7 $110.2 $112.4 $503.5
Gross profit (%) ................. 55.0% 55.1% 50.7% 52.0% 53.3%
Fiscal Year 2002
First Second Third Fourth Full
Quarter Quarter Quarter Quarter Year
(in millions)
Revenues, net ................... $212.5 $217.9 $189.2 $190.1 $809.7
Cost of revenues ................. 96.0 96.0 85.6 92.6 370.2
Gross profit ($) .................. $116.5 $121.9 $103.6 $ 97.5 $439.5
Gross profit (%) ................. 54.8% 55.9% 54.8% 51.3% 54.3%
Gross profit for fiscal 2003 was $503.5 million, up 14.6% from $439.5 million in fiscal 2002. The
change in the gross profit margin percentage for the full year 2003 as compared to 2002 resulted
primarily from factors relating to the timing of our Fall 2003 NACO innovation. These included
significant expenses in the third quarter 2003 relating to the nationwide innovation training meetings
held with our meeting room staff, the write-off of some unused program material and the decision to
keep more meetings open than we normally would have during the lower attendance summer months
in anticipation of the expected increased volume due to the innovation.
Marketing expenses increased $32.4 million, or 39.9%, to $113.6 million in the fiscal year ended
January 3, 2004 from $81.2 million in the fiscal year ended December 28, 2002. During 2003, we made
the decision to increase marketing to support the continuing growth of the business while specifically
targeting some of our key markets. As a percentage of net revenues, marketing expenses increased
from 10.0% in 2002 to 12.0% in 2003. During 2004, we expect our absolute level of marketing spending
to be roughly equivalent on a local currency basis to what we spent in 2003.
Selling, general and administrative expenses were $73.9 million for the fiscal year ended January 3,
2004, an increase of $12.6 million, or 20.6%, from $61.3 million for the fiscal year ended December 28,
2002. The main drivers of this increase were the acquisition of WW Group franchise territories, higher
medical and other insurance rates and legal fees, and expenses associated with additional regulatory
and compliance requirements. The impact of the dollar weakening relative to the currencies of our
international subsidiaries also had the result of increasing selling, general and administrative expenses.
As a percentage of revenue, selling, general and administrative expenses remained fairly consistent at
7.8% as compared to 7.6% last year.
Operating income was $316.1 million for the fiscal year ended January 3, 2004, an increase of
$19.3 million, or 6.5%, from $296.8 million for the fiscal year ended December 28, 2002. Operating
income growth lagged top line revenue growth primarily due to our decision to implement major
increases in marketing spending. Accordingly, our operating income margin fell in fiscal 2003 to 33.5%,
from 36.7% in the prior year. The decline in gross margin from the prior year also contributed to the
operating margin compression.
21