Volvo 2007 Annual Report Download - page 99
Download and view the complete annual report
Please find page 99 of the 2007 Volvo annual report below. You can navigate through the pages in the report by either clicking on the pages listed below, or by using the keyword search tool below to find specific information within the annual report.-
 1
1 -
2
-
3
-
4
-
5
-
6
-
7
-
8
-
9
-
10
-
11
-
12
-
13
-
14
-
15
-
16
-
17
-
18
-
19
-
20
-
21
-
22
-
23
-
24
-
25
-
26
-
27
-
28
-
29
-
30
-
31
-
32
-
33
-
34
-
35
-
36
-
37
-
38
-
39
-
40
-
41
-
42
-
43
-
44
-
45
-
46
-
47
-
48
-
49
-
50
-
51
-
52
-
53
-
54
-
55
-
56
-
57
-
58
-
59
-
60
-
61
-
62
-
63
-
64
-
65
-
66
-
67
-
68
-
69
-
70
-
71
-
72
-
73
-
74
-
75
-
76
-
77
-
78
-
79
-
80
-
81
-
82
-
83
-
84
-
85
-
86
-
87
-
88
-
 89
89 -
 90
90 -
 91
91 -
 92
92 -
 93
93 -
 94
94 -
 95
95 -
 96
96 -
 97
97 -
 98
98 -
 99
99 -
 100
100 -
 101
101 -
 102
102 -
 103
103 -
 104
104 -
 105
105 -
 106
106 -
 107
107 -
 108
108 -
 109
109 -
110
-
111
-
112
-
113
-
114
-
115
-
116
-
117
-
118
-
119
-
120
-
121
-
122
-
123
-
124
-
125
-
126
-
127
-
128
-
129
-
130
-
131
-
132
-
133
-
134
-
135
-
136
-
137
-
138
-
139
-
140
-
141
-
142
-
143
-
144
-
145
-
146
-
147
-
148
-
149
-
150
-
151
-
152
-
153
-
154
-
155
-
156
-
157
-
158
-
159
-
160
-
161
-
162
-
163
-
164
-
165
-
166
 |
 |
Financial information 2007 95
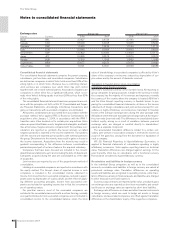
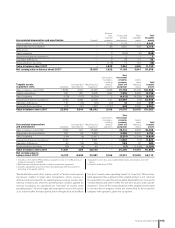
2006 2007
Ingersoll Rand’s
road development
Nissan Diesel division Other
Adjustments Adjustments
Net book to fair Fair Net book to fair Fair Total other
SEK bn Total value value value value value value acquisitions Total
Intangible assets
Product development – 328 2,795 3,123 – 233 233 0 3,356
Trademarks – – 1,974 1,974 – 546 546 67 2,587
Distribution network – – – – – 745 745 58 803
Other intangible assets – 48 (27) 21 687 (687) – 86 107
Other assets and liabilities
Property plant and equipment 73 12,230 (2,650) 9,580 940 217 1,157 489 11,226
Shares and participations 5 937 – 937 – – – 2 939
Inventories 131 2,670 85 2,755 1,141 57 1,198 932 4,885
Current receivables 91 5,517 – 5,517 1,267 – 1,267 421 7,205
Liquid funds 8 1,645 – 1,645 82 – 82 363 2,090
Other assets 0 602 5,375 5,977 45 – 45 263 6,285
Provisions (24) (2,494) (2,667) (5,161) (265) (748) (1,013) (41) (6,215)
Loans (20) (8,226) (3,149) (11,375) – – – (724) (12,099)
Other liabilities (69) (6,676) (275) (6,951) (515) – (515) (1443) (8,909)
Minority interests – (179) – (179) – – – – (179)
195 6,402 1,461 7,863 3,382 363 3,745 473 12,081
Goodwill 5,691 5,604 123 11,418
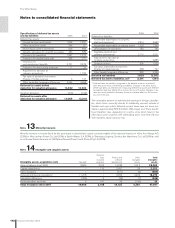
Total net assets 195 13,554 9,349 596 23,499
Less: minority interests – – 0 (82) (82)
Total acquired net assets 195 13,554 9,349 514 23,417
Cash and cash equivalents paid (167) (13,554) (8,889) (514) (22,957)
Cash and cash equivalents
according to acquisition analysis 8 1,645 82 363 2,090
Effect on Group cash and
cash equivalents in the period1 (159) (11,909) (8,807) (151) (20,867)
Cash to be paid – – (460) – (460)
Effect on Group cash
and cash equivalents (159) (11,909) (9,267) (151) (21,327)
The purchase price allocations are preliminary and are expected to be fi nalized within 12 months from the acquisition date.
1 Whereof the effect on the consolidated cash fl ow during 2007 amounts to SEK 15,4 billion.
The effects during 2006 include wholly owned subsidiaries that previ-
ously were accounted for according to the equity method.
During 2007 Nissan Diesel has contributed 486 to the consoli-
dated earnings and 20,308 to the consolidated net sales. In the fi rst
quarter of 2007, Nissan Diesel was reported in accordance with the
equity method. Nissan Diesel reported net sales of 7,007 and net
income of 568 for its total operations for the fi rst quarter of 2007.
During 2007 the Ingersoll Rand’s road construction equipment
division has contributed 60 to the consolidated earnings and 3,317 to
the consolidated net sales. If Volvo would have made the acquisition
at the beginning of the year, the additional contribution to the operat-
ing income and sales would have been approximately 249 and 2,133
respectively excluding depreciation of acquisition adjustments.
Acquisitions presented under Other have not had a material effect
on the consolidated numbers for the Volvo Group.
Acquisitions after the end of the period
Volvo has not made any acquisitions after the end of the period that
have had a signifi cant impact on the Volvo Group.
The Volvo Group has signed a letter of intent with the Indian vehicle
manufacturer Eicher Motors Limited regarding the establishment of a
new Indian joint-venture company. According to the letter of intent, the
joint-venture company will hold Eicher Motors Limited’s truck and bus
operations and the Volvo Group’s Indian sales operations within trucks.
The parties have initiated negotiations regarding a fi nal agreement.
Implementation of the transaction requires the approval of the affected
government authorities and the shareholders in Eicher Motors Lim-
ited. The transaction is expected to be completed before mid-year
2008.
The effects on the Volvo Group’s balance sheet and cash fl ow
statement in connection with the acquisition of subsidiaries and
other business units are specifi ed in the following table based on
valuations on the respective acquisition dates: