Volvo 2007 Annual Report Download - page 116
Download and view the complete annual report
Please find page 116 of the 2007 Volvo annual report below. You can navigate through the pages in the report by either clicking on the pages listed below, or by using the keyword search tool below to find specific information within the annual report.-
 1
1 -
2
-
3
-
4
-
5
-
6
-
7
-
8
-
9
-
10
-
11
-
12
-
13
-
14
-
15
-
16
-
17
-
18
-
19
-
20
-
21
-
22
-
23
-
24
-
25
-
26
-
27
-
28
-
29
-
30
-
31
-
32
-
33
-
34
-
35
-
36
-
37
-
38
-
39
-
40
-
41
-
42
-
43
-
44
-
45
-
46
-
47
-
48
-
49
-
50
-
51
-
52
-
53
-
54
-
55
-
56
-
57
-
58
-
59
-
60
-
61
-
62
-
63
-
64
-
65
-
66
-
67
-
68
-
69
-
70
-
71
-
72
-
73
-
74
-
75
-
76
-
77
-
78
-
79
-
80
-
81
-
82
-
83
-
84
-
85
-
86
-
87
-
88
-
89
-
90
-
91
-
92
-
93
-
94
-
95
-
96
-
97
-
98
-
99
-
100
-
101
-
102
-
103
-
104
-
105
-
 106
106 -
 107
107 -
 108
108 -
 109
109 -
 110
110 -
 111
111 -
 112
112 -
 113
113 -
 114
114 -
 115
115 -
 116
116 -
 117
117 -
 118
118 -
 119
119 -
 120
120 -
 121
121 -
 122
122 -
 123
123 -
 124
124 -
 125
125 -
 126
126 -
127
-
128
-
129
-
130
-
131
-
132
-
133
-
134
-
135
-
136
-
137
-
138
-
139
-
140
-
141
-
142
-
143
-
144
-
145
-
146
-
147
-
148
-
149
-
150
-
151
-
152
-
153
-
154
-
155
-
156
-
157
-
158
-
159
-
160
-
161
-
162
-
163
-
164
-
165
-
166
 |
 |

The Volvo Group
112 Financial information 2007
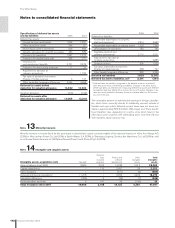
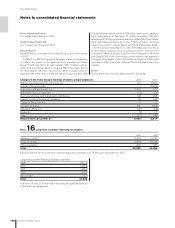
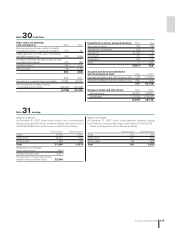
Notes to consolidated fi nancial statements
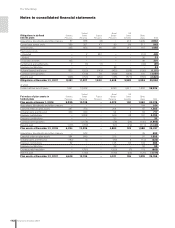
United Great US
Obligations in defi ned Sweden States France Britain Other Other
benefi t plans Pensions Pensions Pensions Pensions benefi ts plans Total
Acquisitions, divestments and other changes 57 688 (8) – 216 1,949 2,902
Current year service costs 259 267 47 90 89 211 963
Interest costs 295 653 60 251 311 115 1,685
Past service costs
– Unvested – 2 457 – – (10) 449
– Vested – 7 – – – 26 33
Termination benefi ts 165 – – – – 36 201
Curtailments and settlements 7 (1) (1) – – (34) (29)
Employee contributions – – – 33 – – 33
Actuarial (gains) and losses 822 (923) (143) (402) (308) (156) (1,110)
Exchange rate translation – (706) 76 (206) (354) 131 (1,059)
Benefi ts paid (296) (797) (259) (145) (571) (756) (2,824)
Obligations at December 31, 2007 8,451 11,207 1,800 4,608 5,582 4,336 35,984
of which
Funded defi ned benefi t plans 7,847 10,928 – 4,050 3,617 1,884 28,326
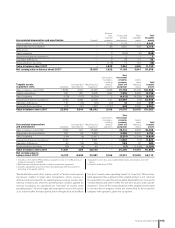
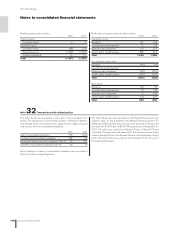
United Great US
Fair value of plan assets in Sweden States France Britain Other Other
funded plans Pensions Pensions Pensions Pensions benefi ts plans Total
Plan assets at January 1, 2006 5,925 10,728 – 4,072 190 1,363 22,278
Acquisitions, divestments and other changes – – – – – 164 164
Expected return on plan assets 347 753 – 204 4 55 1,363
Actuarial gains and (losses) 233 323 – 94 3 64 717
Employer contributions – 2,858 – 646 38 181 3,723
Employee contributions – – – 33 – 2 35
Exchange rate translation – (1,674) – (78) (24) (130) (1,906)
Benefi ts paid (111) (762) – (91) (72) (111) (1,147)
Plan assets at December 31, 2006 6,394 12,226 – 4,880 139 1,588 25,227
Acquisitions, divestments and other changes – 643 – – – 49 692
Expected return on plan assets 384 849 – 275 1 97 1,606
Actuarial gains and (losses) (182) 13 – (45) 4 (12) (222)
Employer contributions 52 – – 135 54 144 385
Employee contributions – – – 33 – 26 59
Exchange rate translation – (751) – (222) (7) 115 (865)
Benefi ts paid – (785) – (145) (55) (129) (1,114)
Plan assets at December 31, 2007 6,648 12,195 – 4,911 136 1,878 25,768