Volvo 2007 Annual Report Download - page 75
Download and view the complete annual report
Please find page 75 of the 2007 Volvo annual report below. You can navigate through the pages in the report by either clicking on the pages listed below, or by using the keyword search tool below to find specific information within the annual report.-
 1
1 -
2
-
3
-
4
-
5
-
6
-
7
-
8
-
9
-
10
-
11
-
12
-
13
-
14
-
15
-
16
-
17
-
18
-
19
-
20
-
21
-
22
-
23
-
24
-
25
-
26
-
27
-
28
-
29
-
30
-
31
-
32
-
33
-
34
-
35
-
36
-
37
-
38
-
39
-
40
-
41
-
42
-
43
-
44
-
45
-
46
-
47
-
48
-
49
-
50
-
51
-
52
-
53
-
54
-
55
-
56
-
57
-
58
-
59
-
60
-
61
-
62
-
63
-
64
-
 65
65 -
 66
66 -
 67
67 -
 68
68 -
 69
69 -
 70
70 -
 71
71 -
 72
72 -
 73
73 -
 74
74 -
 75
75 -
 76
76 -
 77
77 -
 78
78 -
 79
79 -
 80
80 -
 81
81 -
 82
82 -
 83
83 -
 84
84 -
 85
85 -
86
-
87
-
88
-
89
-
90
-
91
-
92
-
93
-
94
-
95
-
96
-
97
-
98
-
99
-
100
-
101
-
102
-
103
-
104
-
105
-
106
-
107
-
108
-
109
-
110
-
111
-
112
-
113
-
114
-
115
-
116
-
117
-
118
-
119
-
120
-
121
-
122
-
123
-
124
-
125
-
126
-
127
-
128
-
129
-
130
-
131
-
132
-
133
-
134
-
135
-
136
-
137
-
138
-
139
-
140
-
141
-
142
-
143
-
144
-
145
-
146
-
147
-
148
-
149
-
150
-
151
-
152
-
153
-
154
-
155
-
156
-
157
-
158
-
159
-
160
-
161
-
162
-
163
-
164
-
165
-
166
 |
 |

Improve customer satisfaction. •
Enhance employee recruitment, devel-•
opment and retention activities.
Execute on market growth plus fee •
income opportunities.
Use better technology and processes •
to improve productivity and customer
service.
Continue to sharpen risk management •
activities.
Higher dealer and business area •
satisfaction.
Commitment to sustainable personnel •
development.
Greater segment penetration and fee •
income.
Prioritized IT strategy. •
Stable portfolio performance.•
Expand and integrate commercial •
offering.
Controlled growth in new, organic and •
acquisition markets.
Extend brand awareness. •
Business cycle vigilance.•
Employee recruitment, development •
and retention.
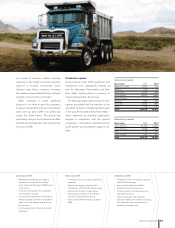
Rand. Toward the end of the year, customers
and dealers of Lingong in China were also
offered tailored financing solutions.
At December 31, 2007 total assets in Cus-
tomer Finance amounted to SEK 95 billion
(80). Excluding receivables in acquired com-
panies, the credit portfolio grew by 12.6%
(5.3), adjusted for exchange-rate movements.
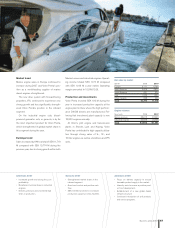
In 2007, VFS maintained its operating
income level and improved the return on equity.
VFS achieved higher penetration levels and
record new business volume. Operating
income amounted to SEK 1,649 M (1,686).
Return on shareholders’ equity was 15.9% in
2007 (13.2). The equity ratio at the end of the
year was 8.1% (10.2).
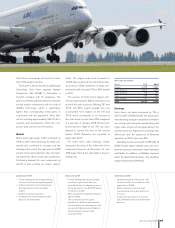
At the end of 2007, write-offs and delin-
quencies remained at low levels within the
credit portfolio. Some softening was experi-
enced in North America, although delinquen-
cies, reposessions and write-offs were at com-
paratively normal levels. The total VFS write-off
ratio was 0.29% (0.33). On December 31,
2007, the total credit reserves were 1.59% of
the segment’s credit portfolio (2.01).
The markets during 2007 were character-
ized by strong competition from other lenders.
During the year, VFS continued to focus on
growing its portfolio in a controlled way, with
emphasis on risk and price management.
Condensed income statement
SEK M 2006 2007
Finance and lease income 7,648 7,705
Finance and lease expenses (4,487) (4,535)
Gross income 3,161 3,170
Selling and administrative
expenses (1,286) (1,437)
Credit provision expenses (190) (125)
Other operating income
and expenses (1) 41
Operating income 1,686 1,649
Income taxes (589) (502)
Income for the period 1,097 1,147
Return on equity, % 13.2 15.9
Distribution of credit portfolio, net
% 2006 2007
Operational leasing 0 0
Financial leasing 40 46
Installment contracts 42 38
Dealer fi nancing 17 15
Other customer credits 1 1
Ambitions 2007 Outcome 2007 Ambitions 2008
Credit portfolio by business area, %
Volvo Trucks 47%
Mack Trucks 7%
Volvo CE 22%
Other 4%
Buses 4%
Renault Trucks 16%
Business areas 2007 71