Volvo 2007 Annual Report Download - page 155
Download and view the complete annual report
Please find page 155 of the 2007 Volvo annual report below. You can navigate through the pages in the report by either clicking on the pages listed below, or by using the keyword search tool below to find specific information within the annual report.-
 1
1 -
2
-
3
-
4
-
5
-
6
-
7
-
8
-
9
-
10
-
11
-
12
-
13
-
14
-
15
-
16
-
17
-
18
-
19
-
20
-
21
-
22
-
23
-
24
-
25
-
26
-
27
-
28
-
29
-
30
-
31
-
32
-
33
-
34
-
35
-
36
-
37
-
38
-
39
-
40
-
41
-
42
-
43
-
44
-
45
-
46
-
47
-
48
-
49
-
50
-
51
-
52
-
53
-
54
-
55
-
56
-
57
-
58
-
59
-
60
-
61
-
62
-
63
-
64
-
65
-
66
-
67
-
68
-
69
-
70
-
71
-
72
-
73
-
74
-
75
-
76
-
77
-
78
-
79
-
80
-
81
-
82
-
83
-
84
-
85
-
86
-
87
-
88
-
89
-
90
-
91
-
92
-
93
-
94
-
95
-
96
-
97
-
98
-
99
-
100
-
101
-
102
-
103
-
104
-
105
-
106
-
107
-
108
-
109
-
110
-
111
-
112
-
113
-
114
-
115
-
116
-
117
-
118
-
119
-
120
-
121
-
122
-
123
-
124
-
125
-
126
-
127
-
128
-
129
-
130
-
131
-
132
-
133
-
134
-
135
-
136
-
137
-
138
-
139
-
140
-
141
-
142
-
143
-
144
-
 145
145 -
 146
146 -
 147
147 -
 148
148 -
 149
149 -
 150
150 -
 151
151 -
 152
152 -
 153
153 -
 154
154 -
 155
155 -
 156
156 -
 157
157 -
 158
158 -
 159
159 -
 160
160 -
 161
161 -
 162
162 -
 163
163 -
 164
164 -
 165
165 -
166
 |
 |
Financial information 2007 151
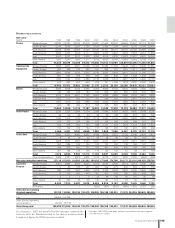
Consolidated balance sheets, Industrial operations
SEK M 1997 1998 1999 2000 2001 2002 2003 2004 2005 2006 2007
Intangible assets 3,262 5,692 6,518 6,781 17,366 16,919 16,662 17,570 20,348 19,054 36,441
Property, plant and equipment 28,755 33,944 17,318 19,652 30,370 27,789 27,248 27,260 31,330 30,493 47,132
Assets under operating leases 1,366 1,817 1,611 4,245 15,020 11,155 8,976 8,477 10,260 11,822 13,850
Shares and participations 9,894 11,744 35,296 37,366 35,145 34,750 30,022 10,116 10,357 16,565 2,189
Inventories 27,756 31,883 21,053 22,998 30,557 27,564 25,848 28,291 33,583 33,893 43,264
Customer-fi nancing receivables 227 384 9 15 114 99 118 230 1,377 1,193 1,233
Interest-bearing receivables 4,664 4,715 18,617 19,286 12,426 8,495 9,413 12,127 7,691 13,214 13,701
Other receivables 25,802 31,398 21,075 24,882 38,815 34,256 33,079 36,535 43,992 43,335 55,970
Non-current assets held for sale – – – – – – – – – 805 –
Liquid funds 16,605 15,439 24,465 10,958 24,874 24,154 28,102 34,628 36,047 29,907 30,026
Assets 118,331 137,016 145,962 146,183 204,687 185,181 179,468 175,234 194,985 200,281 243,806
Shareholders’ equity 62,810 70,179 98,236 88,931 85,576 78,525 72,636 70,155 78,760 87,188 75,129
Provision for post-
employment benefi ts 3,266 2,904 2,118 2,619 14,632 16,218 15,264 14,677 11,966 8,661 9,746
Other provisions 15,962 19,435 9,861 8,277 14,085 13,893 12,792 14,115 17,164 19,385 25,372
Loans 1,047 5,018 12,206 18,233 29,710 22,494 24,677 13,968 13,097 9,779 38,286
Liabilities associated with
assets held for sale – – – – – – – – – 280 –
Other liabilities 35,246 39,480 23,541 28,123 60,684 54,051 54,099 62,319 73,998 74,988 95,273
Shareholders’ equity
and liabilities 118,331 137,016 145,962 146,183 204,687 185,181 179,468 175,234 194,985 200,281 243,806