Volvo 2007 Annual Report Download - page 146
Download and view the complete annual report
Please find page 146 of the 2007 Volvo annual report below. You can navigate through the pages in the report by either clicking on the pages listed below, or by using the keyword search tool below to find specific information within the annual report.-
 1
1 -
2
-
3
-
4
-
5
-
6
-
7
-
8
-
9
-
10
-
11
-
12
-
13
-
14
-
15
-
16
-
17
-
18
-
19
-
20
-
21
-
22
-
23
-
24
-
25
-
26
-
27
-
28
-
29
-
30
-
31
-
32
-
33
-
34
-
35
-
36
-
37
-
38
-
39
-
40
-
41
-
42
-
43
-
44
-
45
-
46
-
47
-
48
-
49
-
50
-
51
-
52
-
53
-
54
-
55
-
56
-
57
-
58
-
59
-
60
-
61
-
62
-
63
-
64
-
65
-
66
-
67
-
68
-
69
-
70
-
71
-
72
-
73
-
74
-
75
-
76
-
77
-
78
-
79
-
80
-
81
-
82
-
83
-
84
-
85
-
86
-
87
-
88
-
89
-
90
-
91
-
92
-
93
-
94
-
95
-
96
-
97
-
98
-
99
-
100
-
101
-
102
-
103
-
104
-
105
-
106
-
107
-
108
-
109
-
110
-
111
-
112
-
113
-
114
-
115
-
116
-
117
-
118
-
119
-
120
-
121
-
122
-
123
-
124
-
125
-
126
-
127
-
128
-
129
-
130
-
131
-
132
-
133
-
134
-
135
-
 136
136 -
 137
137 -
 138
138 -
 139
139 -
 140
140 -
 141
141 -
 142
142 -
 143
143 -
 144
144 -
 145
145 -
 146
146 -
 147
147 -
 148
148 -
 149
149 -
 150
150 -
 151
151 -
 152
152 -
 153
153 -
 154
154 -
 155
155 -
 156
156 -
157
-
158
-
159
-
160
-
161
-
162
-
163
-
164
-
165
-
166
 |
 |

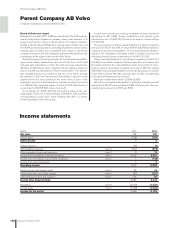
Parent Company AB Volvo
142 Financial information 2007
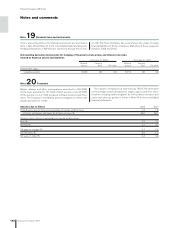
Notes and comments
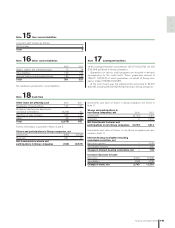
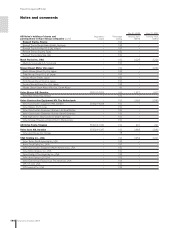
Note 20 Personnel
Note 19 Financial risks and instruments
Wages, salaries and other remunerations amounted to 203 (204).
Social costs amounted to 137 (142) of which pension costs, 96 (105).
Of the pension costs 27 (32) pertained to Board members and Presi-
dents. The Company’s outstanding pension obligations to these indi-
viduals amounted to 1 (141).
Volvo’s accounting policies for fi nancial instruments are described in
Note 1, Note 36 and Note 37 to the consolidated fi nancial statements.
Hedging transactions in AB Volvo are carried out through Volvo Treas-
The number of employees at year-end was 182 (176). Information
on the average number of employees, wages, salaries and other remu-
nerations including option programs as well as Board members and
senior executives by gender is shown in Note 34 to the consolidated
fi nancial statements.
ury AB. The Parent Company has used interest-rate swaps to hedge
fi nancial liabilities of Group companies. Maturities of these swaps are
between 2008 and 2009.
Outstanding derivative instruments for hedging of fi nancial currency risks and interest rate risks
related to fi nancial assets and liabilities
December 31, 2006 December 31, 2007
Notional Carrying Notional Carrying
amount value Fair value amount value Fair value
Interest-rate swaps
– payable position 5,430 (4) (4) 5,110 (2) (2)
Absence due to illness 2006 2007
Total absence due to illness in percentage of regular working hours 1.4 1.8
of which, continuous sick leave for 60 days or more, % 44.0 62.1
Absence due to illness in percentage of regular working hours
Men, % 0.8 0.5
Women, % 2.1 3.2
29 years or younger, % 0.7 0.2
30–49 years, % 0.9 1.2
50 years or older, % 2.4 3.2