Volvo 2007 Annual Report Download - page 115
Download and view the complete annual report
Please find page 115 of the 2007 Volvo annual report below. You can navigate through the pages in the report by either clicking on the pages listed below, or by using the keyword search tool below to find specific information within the annual report.-
 1
1 -
2
-
3
-
4
-
5
-
6
-
7
-
8
-
9
-
10
-
11
-
12
-
13
-
14
-
15
-
16
-
17
-
18
-
19
-
20
-
21
-
22
-
23
-
24
-
25
-
26
-
27
-
28
-
29
-
30
-
31
-
32
-
33
-
34
-
35
-
36
-
37
-
38
-
39
-
40
-
41
-
42
-
43
-
44
-
45
-
46
-
47
-
48
-
49
-
50
-
51
-
52
-
53
-
54
-
55
-
56
-
57
-
58
-
59
-
60
-
61
-
62
-
63
-
64
-
65
-
66
-
67
-
68
-
69
-
70
-
71
-
72
-
73
-
74
-
75
-
76
-
77
-
78
-
79
-
80
-
81
-
82
-
83
-
84
-
85
-
86
-
87
-
88
-
89
-
90
-
91
-
92
-
93
-
94
-
95
-
96
-
97
-
98
-
99
-
100
-
101
-
102
-
103
-
104
-
 105
105 -
 106
106 -
 107
107 -
 108
108 -
 109
109 -
 110
110 -
 111
111 -
 112
112 -
 113
113 -
 114
114 -
 115
115 -
 116
116 -
 117
117 -
 118
118 -
 119
119 -
 120
120 -
 121
121 -
 122
122 -
 123
123 -
 124
124 -
 125
125 -
126
-
127
-
128
-
129
-
130
-
131
-
132
-
133
-
134
-
135
-
136
-
137
-
138
-
139
-
140
-
141
-
142
-
143
-
144
-
145
-
146
-
147
-
148
-
149
-
150
-
151
-
152
-
153
-
154
-
155
-
156
-
157
-
158
-
159
-
160
-
161
-
162
-
163
-
164
-
165
-
166
 |
 |

Financial information 2007 111
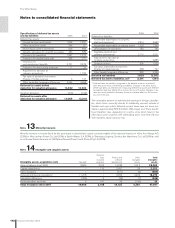
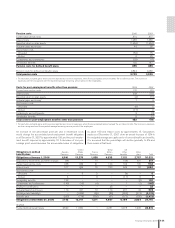
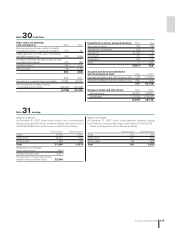
Pension costs 2006 2007
Current year service costs 870 877
Interest costs 1,285 1,380
Expected return on plan assets (1,359) (1,653)
Actuarial gains and losses1 48 68
Past service costs
– Unvested (56) 15
– Vested 0 25
Curtailments and settlements (28) (4)
Termination benefi ts 135 147
Pension costs for defi ned benefi t plans 895 855
Pension costs for defi ned contribution plans 2,844 3,080
Total pension costs 3,739 3,935
1 For each plan, actuarial gains and losses are reported as income or expenses, when the accumulated amount exceeds the so called corridor. The income or
expenses are then recognized over the expected average remaining service period of the employees.
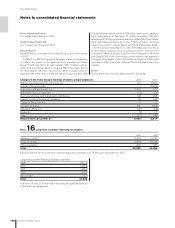
Costs for post-employment benefi ts other than pensions 2006 2007
Current year service costs 132 129
Interest costs 348 319
Expected return on plan assets (4) (11)
Actuarial gains and losses1 1 4
Past service costs
– Unvested (9) 5
– Vested (17) 0
Curtailments and settlements 3 (2)
Termination benefi ts 8 32
Total costs for post-employment benefi ts other than pensions 462 476
1 For each plan, actuarial gains and losses are reported as income or expenses, when the accumulated amount exceed the so called corridor. The income or expenses
are then recognized over the expected average remaining service period of the employees.
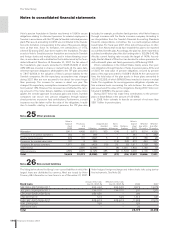
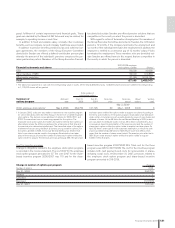
An increase of one percentage point per year in healthcare costs
would change the accumulated post-employment benefi t obligation
as of December 31, 2007 by approximately 198, and the post-employ-
ment benefi t expense by approximately 18. A decrease of one per-
centage point would decrease the accumulated value of obligations
by about 169 and reduce costs by approximately 15. Calculations
made as of December 31, 2007 show an annual increase of 10% in
the weighted average per capita costs of covered healthcare benefi ts;
it is assumed that the percentage will decline gradually to 5% and
then remain at that level.
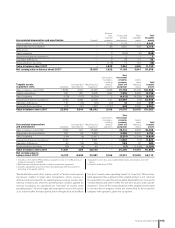
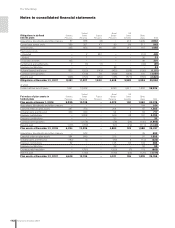
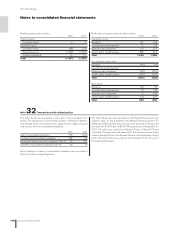
United Great US
Obligations in defi ned Sweden States France Britain Other Other
benefi t plans Pensions Pensions Pensions Pensions benefi ts plans Total
Obligations at January 1, 2006 6,841 13,279 1,858 4,635 7,151 2,757 36,521
Acquisitions, divestments and other changes (54) – 14 – (44) 301 217
Current year service costs 248 246 41 103 104 190 932
Interest costs 277 686 70 220 345 92 1,690
Past service costs
– Unvested – 6 2 – (8) – 0
– Vested 4 – 8 – (17) 6 1
Termination benefi ts 122 – – – – (2) 120
Curtailments and settlements (146) (15) (4) – 1 (1) (165)
Employee contributions – – – 33 – – 33
Actuarial (gains) and losses 113 437 10 173 201 44 978
Exchange rate translation – (1,844) (69) (86) (962) (213) (3,174)
Benefi ts paid (263) (778) (359) (91) (572) (350) (2,413)
Obligations at December 31, 2006 7,142 12,017 1,571 4,987 6,199 2,824 34,740
of which
Funded defi ned benefi t plans 6,560 11,830 – 4,451 3,978 1,996 28,815