Volvo 2007 Annual Report Download - page 49
Download and view the complete annual report
Please find page 49 of the 2007 Volvo annual report below. You can navigate through the pages in the report by either clicking on the pages listed below, or by using the keyword search tool below to find specific information within the annual report.-
 1
1 -
2
-
3
-
4
-
5
-
6
-
7
-
8
-
9
-
10
-
11
-
12
-
13
-
14
-
15
-
16
-
17
-
18
-
19
-
20
-
21
-
22
-
23
-
24
-
25
-
26
-
27
-
28
-
29
-
30
-
31
-
32
-
33
-
34
-
35
-
36
-
37
-
38
-
 39
39 -
 40
40 -
 41
41 -
 42
42 -
 43
43 -
 44
44 -
 45
45 -
 46
46 -
 47
47 -
 48
48 -
 49
49 -
 50
50 -
 51
51 -
 52
52 -
 53
53 -
 54
54 -
 55
55 -
 56
56 -
 57
57 -
 58
58 -
 59
59 -
60
-
61
-
62
-
63
-
64
-
65
-
66
-
67
-
68
-
69
-
70
-
71
-
72
-
73
-
74
-
75
-
76
-
77
-
78
-
79
-
80
-
81
-
82
-
83
-
84
-
85
-
86
-
87
-
88
-
89
-
90
-
91
-
92
-
93
-
94
-
95
-
96
-
97
-
98
-
99
-
100
-
101
-
102
-
103
-
104
-
105
-
106
-
107
-
108
-
109
-
110
-
111
-
112
-
113
-
114
-
115
-
116
-
117
-
118
-
119
-
120
-
121
-
122
-
123
-
124
-
125
-
126
-
127
-
128
-
129
-
130
-
131
-
132
-
133
-
134
-
135
-
136
-
137
-
138
-
139
-
140
-
141
-
142
-
143
-
144
-
145
-
146
-
147
-
148
-
149
-
150
-
151
-
152
-
153
-
154
-
155
-
156
-
157
-
158
-
159
-
160
-
161
-
162
-
163
-
164
-
165
-
166
 |
 |

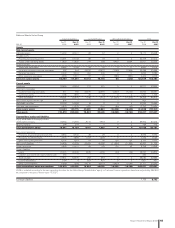
Balance Sheets Volvo Group
Industrial operations Customer Finance Elim. and reclassifi cations Total
Dec 31 Dec 31 Dec 31 Dec 31 Dec 31 Dec 31 Dec 31 Dec 31
SEK M 2006 2007 2006 2007 2006 2007 2006 2007
Assets
Non-current assets
Intangible assets 19,054 36,441 62 67 0 0 19,117 36,508
Tangible assets
Property, plant and equipment 34,291 47,132 88 78 0 0 34,379 47,210
Assets under operating leases 11,822 13,850 279 288 8,400 8,364 20,501 22,502
Financial assets
Shares and participation 6,862 2,189 29 30 0 0 6,890 2,219
Long-term customer-fi nancing receivables 582 444 39,276 47,870 (7,769) (7,828) 32,089 40,486
Deferred tax assets 6,300 8,434 354 346 9 3 6,663 8,783
Other long-term receivables 4,958 5,601 27 39 (585) (861) 4,400 4,779
Total non-current assets 83,869 114,091 40,115 48,718 55 (322) 124,039 162,487
Current assets
Inventories 33,894 43,264 317 381 0 0 34,211 43,645
Short-term receivables
Customer-fi nancing receivables 611 789 36,979 42,695 (4,937) (5,123) 32,653 38,361
Current tax assets 1,196 1,660 25 43 0 0 1,221 1,703
Other receivables 44,561 53,976 1,145 1,713 (11,307) (11,272) 34,399 44,417
Non-current assets held for sale 805 – – – – – 805 –
Marketable securities 20,324 16,488 18 2 0 0 20,342 16,490
Cash and cash equivalents 9,618 13,538 1,203 1,053 (64) (47) 10,757 14,544
Total current assets 111,009 129,715 39,687 45,887 (16,308) (16,442) 134,388 159,160
Total assets 194,878 243,806 79,802 94,605 (16,253) (16,764) 258,427 321,647
Shareholders’ equity and liabilities
Equity attributable to the equity holders
of the parent company 78,763 74,550 8,141 7,652 0 0 86,904 82,202
Minority interests 284 579 0 0 0 0 284 579
Total shareholders’ equity 79,047 75,129 8,141 7,652 0 0 87,188 82,781
Non-current provisions
Provisions for post-employment benefi ts 8,664 9,746 28 28 0 0 8,692 9,774
Provisions for deferred taxes 3,315 7,868 1,107 1,259 0 0 4,422 9,127
Other non-current provisions 6,507 7,067 87 95 156 139 6,750 7,301
Non-current liabilities 24,458 41,339 32,654 42,285 (11,654) (11,895) 45,457 71,729
Current provisions 9,643 10,437 48 129 109 90 9,799 10,656
Current liabilities
Loans 25,615 40,539 2,675 4,382 (44) (49) 28,247 44,872
Liabilities associated with assets held for sale 280 – – – – – 280 –
Trade payables 37,831 52,376 252 287 0 0 38,080 52,663
Current tax liabilities 1,164 0 637 451 0 0 1,801 451
Other current liabilities (1,646) (695) 34,173 38,037 (4,820) (5,049) 27,711 32,293
Total shareholders’ equity and liabilities 194,878 243,806 79,802 94,605 (16,253) (16,764) 258,427 321,647
2006 is restated according to the new reporting structure for the Volvo Group. Shareholders’ equity in Customer Finance operations have been adjusted by SEK 650
M compared to the press release April 17, 2007.
Contingent liabilities 7,726 8,153
Board of Directors’ Report 2007 45