Volvo 2007 Annual Report Download - page 103
Download and view the complete annual report
Please find page 103 of the 2007 Volvo annual report below. You can navigate through the pages in the report by either clicking on the pages listed below, or by using the keyword search tool below to find specific information within the annual report.-
 1
1 -
2
-
3
-
4
-
5
-
6
-
7
-
8
-
9
-
10
-
11
-
12
-
13
-
14
-
15
-
16
-
17
-
18
-
19
-
20
-
21
-
22
-
23
-
24
-
25
-
26
-
27
-
28
-
29
-
30
-
31
-
32
-
33
-
34
-
35
-
36
-
37
-
38
-
39
-
40
-
41
-
42
-
43
-
44
-
45
-
46
-
47
-
48
-
49
-
50
-
51
-
52
-
53
-
54
-
55
-
56
-
57
-
58
-
59
-
60
-
61
-
62
-
63
-
64
-
65
-
66
-
67
-
68
-
69
-
70
-
71
-
72
-
73
-
74
-
75
-
76
-
77
-
78
-
79
-
80
-
81
-
82
-
83
-
84
-
85
-
86
-
87
-
88
-
89
-
90
-
91
-
92
-
 93
93 -
 94
94 -
 95
95 -
 96
96 -
 97
97 -
 98
98 -
 99
99 -
 100
100 -
 101
101 -
 102
102 -
 103
103 -
 104
104 -
 105
105 -
 106
106 -
 107
107 -
 108
108 -
 109
109 -
 110
110 -
 111
111 -
 112
112 -
 113
113 -
114
-
115
-
116
-
117
-
118
-
119
-
120
-
121
-
122
-
123
-
124
-
125
-
126
-
127
-
128
-
129
-
130
-
131
-
132
-
133
-
134
-
135
-
136
-
137
-
138
-
139
-
140
-
141
-
142
-
143
-
144
-
145
-
146
-
147
-
148
-
149
-
150
-
151
-
152
-
153
-
154
-
155
-
156
-
157
-
158
-
159
-
160
-
161
-
162
-
163
-
164
-
165
-
166
 |
 |
Financial information 2007 99
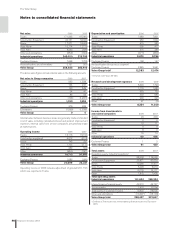
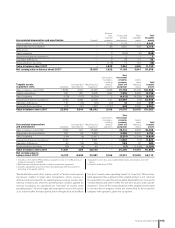
Total shareholders’ equity and liabilities 2006 2007
Operating liabilities, Industrial operations:1
Trucks 63,652 77,975
Construction Equipment 12,352 18,310
Buses 4,984 6,072
Volvo Penta 2,728 3,254
Volvo Aero 4,312 4,137
Other 872 372
Total operating liabilities
Industrial operations 88,900 110,120
Financial liabilities 20,136 48,032
Tax liabilities 4,624 8,519
Total liabilities in Customer Finance 71,661 86,953
Other and eliminations (14,082) (14,758)
Total liabilities 171,239 238,866
Shareholders’ equity 87,188 82,781
Volvo Group total 258,427 321,647
1 Defi ned as Total liabilities less Shareholders’ equity, Financial liabilities and Tax
liabilities.
Investments in associated companies 2006 2007
Trucks 5,498 292
Construction Equipment – –
Buses 43 55
Volvo Penta – –
Volvo Aero 1 1
Customer Finance 24 25
Other 228 284
Volvo Group total 5,794 657
Trucks 2006 includes investment in Nissan Diesel of 5,445.
Capital expenditures 2006 2007
Trucks 6,340 5,816
Construction Equipment 1,804 2,795
Buses 406 405
Volvo Penta 461 510
Volvo Aero 853 824
Other 64 31
Industrial operations 9,928 10,381
Customer Finance 666 291
Reclassifi cation Group versus segment
Customer Finance 3,440 4,266
Volvo Group total 14,034 14,938
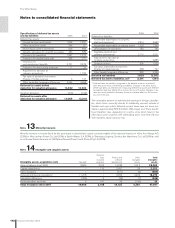
Reporting by geographical segment
Net sales 2006 2007
Europe 138,342 158,019
North America 74,928 50,651
South America 13,159 16,237
Asia 19,655 42,513
Other markets 12,751 17,985
Volvo Group total* 258,835 285,405
*of which:
Sweden 13,805 13,987
United States 61,793 39,697
France 31,155 31,327
Total assets 2006 2007
Sweden 81,173 76,832
Europe excluding Sweden 91,163 110,806
North America 58,444 61,218
South America 10,766 13,521
Asia 11,512 51,879
Other markets 5,369 7,391
Volvo Group total 258,427 321,647
Capital expenditures 2006 2007
Sweden 3,970 3,444
Europe excluding Sweden 7,395 6,991
North America 1,851 2,806
South America 280 220
Asia 421 1,365
Other markets 117 112
Volvo Group total 14,034 14,938
Note 8 Other operating income and expenses
2006 2007
Gains/losses on currency related forward and options contracts 481 453
Exchange rate differences on trade receivables and payables (825) 96
Gains/losses on divestment of group companies 286 324
Change in allowances and write-offs for doubtful receivables, customer fi nancing (189) (121)
Change in allowances and write-offs for doubtful receivables, other (273) 18
Expenses for closing Volvo operations in Bromma, Sweden (258) (62)
Volvo profi t sharing program (444) (436)
Adjustment of goodwill in the subsidiary Mack Trucks (1,712) –
Other income and expenses (532) (109)
Total (3,466) 163