Volvo 2007 Annual Report Download - page 129
Download and view the complete annual report
Please find page 129 of the 2007 Volvo annual report below. You can navigate through the pages in the report by either clicking on the pages listed below, or by using the keyword search tool below to find specific information within the annual report.-
 1
1 -
2
-
3
-
4
-
5
-
6
-
7
-
8
-
9
-
10
-
11
-
12
-
13
-
14
-
15
-
16
-
17
-
18
-
19
-
20
-
21
-
22
-
23
-
24
-
25
-
26
-
27
-
28
-
29
-
30
-
31
-
32
-
33
-
34
-
35
-
36
-
37
-
38
-
39
-
40
-
41
-
42
-
43
-
44
-
45
-
46
-
47
-
48
-
49
-
50
-
51
-
52
-
53
-
54
-
55
-
56
-
57
-
58
-
59
-
60
-
61
-
62
-
63
-
64
-
65
-
66
-
67
-
68
-
69
-
70
-
71
-
72
-
73
-
74
-
75
-
76
-
77
-
78
-
79
-
80
-
81
-
82
-
83
-
84
-
85
-
86
-
87
-
88
-
89
-
90
-
91
-
92
-
93
-
94
-
95
-
96
-
97
-
98
-
99
-
100
-
101
-
102
-
103
-
104
-
105
-
106
-
107
-
108
-
109
-
110
-
111
-
112
-
113
-
114
-
115
-
116
-
117
-
118
-
 119
119 -
 120
120 -
 121
121 -
 122
122 -
 123
123 -
 124
124 -
 125
125 -
 126
126 -
 127
127 -
 128
128 -
 129
129 -
 130
130 -
 131
131 -
 132
132 -
 133
133 -
 134
134 -
 135
135 -
 136
136 -
 137
137 -
 138
138 -
 139
139 -
140
-
141
-
142
-
143
-
144
-
145
-
146
-
147
-
148
-
149
-
150
-
151
-
152
-
153
-
154
-
155
-
156
-
157
-
158
-
159
-
160
-
161
-
162
-
163
-
164
-
165
-
166
 |
 |

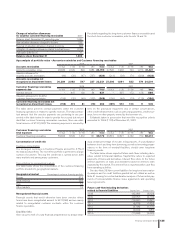
Financial information 2007 125
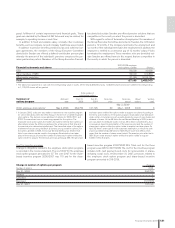
Age analysis of portfolio value – Accounts receivables and Customer fi nancing receivables
2006 2007
Accounts receivables not due 1–30 31–90 >90 Total not due 1–30 31–90 >90 Total
Accounts receivables gross 20,383 2,129 594 1,084 24,190 27,520 1,930 704 1,273 31,427
Valuation allowance for
doubtful accounts receivables (99) (36) (47) (757) (939) (214) (39) (71) (599) (923)
Accounts receivables not
recognized as impairment losses 20,284 2,093 547 327 23,251 27,306 1,891 633 674 30,504
Customer fi nancing receivables 2006 2007
payments due not due 1–30 31–90 >90 Total not due 1–30 31–90 >90 Total
Overdue amount – 447 130 54 631 – 597 173 126 896
Valuation allowance for doubtful
customer fi nancing receivables (155) (32) (49) (132) (368) (159) (46) (70) (115) (390)
Customer fi nancing receivables not
recognized as impairment losses (155) 415 81 (78) 263 (159) 551 103 11 506
Customer fi nancing receivables 2006 2007
total exposure not due 1–30 31–90 >90 Total not due 1–30 31–90 >90 Total
Customer fi nancing receivables 55,303 8,726 1,412 731 66,172 66,812 10,527 2,162 709 80,210
Concentration of credit risk
Customer concentration
The ten largest customers in Customer Finance account for 4.7% of
the total asset portfolio. The rest of the portfolio is pertinent to a large
number of customer. This way the credit risk is spread across both
many markets and among many customers.
Concentration by geographical markets
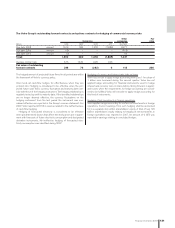
The table below shows the concentration of the customer fi nancing
portfolio divided into geographical markets.
Geographical market Percentage of customer fi nancing portfolio
Europe 57.5
North America 29.9
Asia 5.6
Other markets 7.0
Renegotiated fi nancial assets
Financial assets that would otherwise have been overdue whose
terms have been renegotiated amount to 937 (996) and are mainly
related to renegotiated customer contracts within the customer
fi nance operations.
Liquidity risks
Volvo assures itself of sound fi nancial preparedness by always keep-
Change of valuation allowances
for doubtful customer fi nancing receivables 2007
Balance sheet, December 31, preceding year 1,430
New valuation allowance charged to income 235
Reversal of valuation allowance charged to income (92)
Utilization of valuation allowance related to actual losses (227)
Translation differences 17
Balance sheet, December 31 1,363
For details regarding the long-term customer fi nance receivables and
the short-term customer receivables, refer to note 16 and 19.
The table above presents overdue payments within the customer
fi nancing operations in relation to specifi c reserves. The total contrac-
tual amount that the overdue payments are pertaining to are pre-
sented in the table below. In order to provide for occured but not yet
identifi ed customer fi nancing receivables overdues, there are addi-
tional reserves of 973 (1,062). The remaining exposure is secured by
liens on the purchased equipment, and, in certain circumstances,
other credit enhancements such as personal guarantees, credit insur-
ance, liens on other property owned by the borrower etc.
Collaterals taken in possession that meet the recognition criteria
amounted to 129.9 (111.9) at December 31, 2007.
ing a certain percentage of its sales in liquid assets. A sound balance
between short- and long-term borrowing, as well as borrowing prepar-
edness in the form of overdraft facilities, should cover long-term
fi nancing needs.
The table below shows expected future cash-fl ows including deriv-
atives related to fi nancial liabilities. Capital fl ow refers to expected
payments of loans and derivatives. Interest fl ow refers to the future
interest payments on loans and derivatives based on interests rates
expected by the market. The interest fl ow is reported within cash fl ow
from operating activities.
See also Note 26 Non-current liabilities for long-term loans matur-
ity analysis and for credit facilities granted but not utilized as well as
Note 31 Leasing for contractual duration analysis of future rental pay-
ments of noncancellable fi nance lease agreements and operating
lease agreements.
Future cash-fl ow including derivatives
related to fi nancial liabilities Capital fl ow Interest fl ow
2008 (42,380) (3,928)
2009 (22,557) (2,716)
2010 (12,661) (1,891)
2011 (5,678) (1,426)
2012 (3,196) (1,171)
2013 (2,604) (986)
2014– (17,693) (2,425)