Volvo 2007 Annual Report Download - page 21
Download and view the complete annual report
Please find page 21 of the 2007 Volvo annual report below. You can navigate through the pages in the report by either clicking on the pages listed below, or by using the keyword search tool below to find specific information within the annual report.-
 1
1 -
2
-
3
-
4
-
5
-
6
-
7
-
8
-
9
-
10
-
 11
11 -
 12
12 -
 13
13 -
 14
14 -
 15
15 -
 16
16 -
 17
17 -
 18
18 -
 19
19 -
 20
20 -
 21
21 -
 22
22 -
 23
23 -
 24
24 -
 25
25 -
 26
26 -
 27
27 -
 28
28 -
 29
29 -
 30
30 -
 31
31 -
32
-
33
-
34
-
35
-
36
-
37
-
38
-
39
-
40
-
41
-
42
-
43
-
44
-
45
-
46
-
47
-
48
-
49
-
50
-
51
-
52
-
53
-
54
-
55
-
56
-
57
-
58
-
59
-
60
-
61
-
62
-
63
-
64
-
65
-
66
-
67
-
68
-
69
-
70
-
71
-
72
-
73
-
74
-
75
-
76
-
77
-
78
-
79
-
80
-
81
-
82
-
83
-
84
-
85
-
86
-
87
-
88
-
89
-
90
-
91
-
92
-
93
-
94
-
95
-
96
-
97
-
98
-
99
-
100
-
101
-
102
-
103
-
104
-
105
-
106
-
107
-
108
-
109
-
110
-
111
-
112
-
113
-
114
-
115
-
116
-
117
-
118
-
119
-
120
-
121
-
122
-
123
-
124
-
125
-
126
-
127
-
128
-
129
-
130
-
131
-
132
-
133
-
134
-
135
-
136
-
137
-
138
-
139
-
140
-
141
-
142
-
143
-
144
-
145
-
146
-
147
-
148
-
149
-
150
-
151
-
152
-
153
-
154
-
155
-
156
-
157
-
158
-
159
-
160
-
161
-
162
-
163
-
164
-
165
-
166
 |
 |

Net sales growth1, % Operating margin1, % Net fi nancial position as percent-
age of shareholders’ equity1, %
1 Years 2004–2007 reported in accordance with IFRS and 2003 in accordance with prevailing Swedish GAAP. See Note 1 and 3.
2 Excluding adjustment of goodwill in 2006.
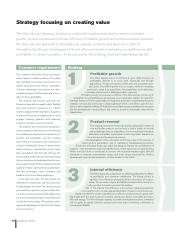
Growth
Volvo Group’s growth target is that net sales
should increase by a minimum of 10% annually.
This objective will be achieved through organic
growth and acquisitions. Net sales rose 10%
in 2007. During the period 2003–2007, the
average growth rate was 9.2% annually.
Operating margin
The Volvo Group’s profi tability target is that
operating margin for the industrial operations
is to exceed an average of 7% annually over a
business cycle.
The operating margin for 2007 was 7.8%.
The average annual operating margin for the
Volvo Group was 6.7% from 2003 to 2007.
Capital structure
The capital structure target is set to a net debt
for the industrial operations of a maximum of
40% of shareholders’ equity.
As of December 31, 2007, the Volvo Group
had a net fi nancial debt position correspond-
ing to 5.7% of shareholders’ equity.
29.2
06
(5.7)
07
(3.3)
03
40
20
(20)
(40)
(60)
0
25.8
04
23.7
05
8.9
06
7.8
07
1.4
03
0
7
5
7.3
04
7.9
05
2
7
06
10
07
(
1)
03
0
10
16
04
14
05
Board of Directors´ Report 2007 17