Volvo 2007 Annual Report Download - page 126
Download and view the complete annual report
Please find page 126 of the 2007 Volvo annual report below. You can navigate through the pages in the report by either clicking on the pages listed below, or by using the keyword search tool below to find specific information within the annual report.-
 1
1 -
2
-
3
-
4
-
5
-
6
-
7
-
8
-
9
-
10
-
11
-
12
-
13
-
14
-
15
-
16
-
17
-
18
-
19
-
20
-
21
-
22
-
23
-
24
-
25
-
26
-
27
-
28
-
29
-
30
-
31
-
32
-
33
-
34
-
35
-
36
-
37
-
38
-
39
-
40
-
41
-
42
-
43
-
44
-
45
-
46
-
47
-
48
-
49
-
50
-
51
-
52
-
53
-
54
-
55
-
56
-
57
-
58
-
59
-
60
-
61
-
62
-
63
-
64
-
65
-
66
-
67
-
68
-
69
-
70
-
71
-
72
-
73
-
74
-
75
-
76
-
77
-
78
-
79
-
80
-
81
-
82
-
83
-
84
-
85
-
86
-
87
-
88
-
89
-
90
-
91
-
92
-
93
-
94
-
95
-
96
-
97
-
98
-
99
-
100
-
101
-
102
-
103
-
104
-
105
-
106
-
107
-
108
-
109
-
110
-
111
-
112
-
113
-
114
-
115
-
 116
116 -
 117
117 -
 118
118 -
 119
119 -
 120
120 -
 121
121 -
 122
122 -
 123
123 -
 124
124 -
 125
125 -
 126
126 -
 127
127 -
 128
128 -
 129
129 -
 130
130 -
 131
131 -
 132
132 -
 133
133 -
 134
134 -
 135
135 -
 136
136 -
137
-
138
-
139
-
140
-
141
-
142
-
143
-
144
-
145
-
146
-
147
-
148
-
149
-
150
-
151
-
152
-
153
-
154
-
155
-
156
-
157
-
158
-
159
-
160
-
161
-
162
-
163
-
164
-
165
-
166
 |
 |

The Volvo Group
122 Financial information 2007
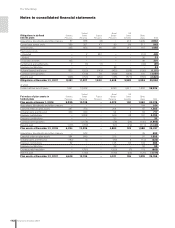
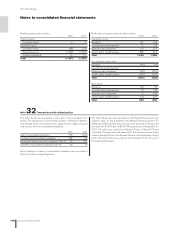
Notes to consolidated fi nancial statements
2006 2007
Number of of which Number of of which
Average number of employees employees women, % employees women, %
AB Volvo
Sweden 160 51 178 51
Subsidiaries
Sweden 26,722 19 27,826 20
Western Europe 26,380 15 27,340 15
Eastern Europe 4,225 16 5,027 18
North America 14,609 20 11,716 19
South America 3,874 13 4,664 13
Asia 4,075 15 12,824 10
Other countries 2,255 12 2,685 20
Group total 82,300 17 92,260 17
2006 2007
Number at of which Number at of which
Board members and chief offi cers year-end women, % year-end women %
AB Volvo
Board members 11 9 11 9
CEO and GEC 17 6 18 6
Volvo Group
Board members 939 11 954 11
Presidents and other senior executives 1,422 15 1,678 15
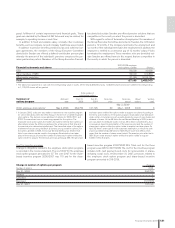
2006 2007
of which of which
Board and variable Other Board and variable Other
Wages salaries and other remuneration, SEK M Presidents1 salaries employees Presidents1 salaries employees
AB Volvo
Sweden 33.4 11.2 170.8 37.9 14.0 165.4
Subsidiaries
Sweden 93.1 29.3 9,760.8 79.2 30.6 10,426.3
Western Europe 442.0 8.0 9,380.7 495.9 24.3 10,482.3
Eastern Europe 37.6 2.9 521.8 56.8 7.3 863.5
North America 187.5 6.8 6,537.0 189.5 23.2 5,800.1
South America 22.1 4.1 617.9 15.3 1.7 766.7
Asia 56.7 1.7 1,053.7 168.3 13.0 3,564.5
Other countries 28.6 0.9 481.7 49.8 6.3 543.8
Group total 901.0 64.9 28,524.4 1,092.7 120.4 32,612.6
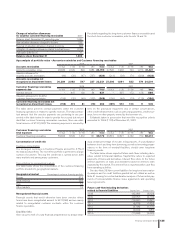
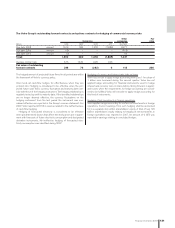
2006 2007
Wages, Wages,
Wages, salaries, other remuneration salaries, Social of which salaries, Social of which
and social costs, SEK M remunerations costs pens. costs remunerations costs pens. costs
AB Volvo2 204.2 141.6 104.9 203.3 106.9 66.0
Subsidiaries 29,221.3 10,047.2 3,634.2 33,502.0 10,638.0 3,868.8
Group total3 29,425.5 10,188.8 3,739.1 33,705.3 10,744.9 3,934.8
1 Including current and former Board members, Presidents and Executive Vice
Presidents.
2 The Parent Company’s pension costs, pertaining to Board members and Presi-
dents are disclosed in Note 20 in the Parent Company.
3 Of the Group’s pension costs, 288.4 (181.7) pertain to Board members and
Presidents, including current and former Board members, Presidents and
Executive Vice Presidents. The Group’s outstanding pension obligations to
these individuals amount to 183.3 (461.2).
The cost for non-monetary benefi ts in the Group amounted to 1,500.9
(1,247.0) of which 41.0 (43.7) to Board members and presidents.
The cost for non-monetary benefi ts in the Parent company
amounted to 11.2 (10.1) of which 1.0 (1.3) to Board members and
presidents.