Virgin Media 2008 Annual Report Download - page 71
Download and view the complete annual report
Please find page 71 of the 2008 Virgin Media annual report below. You can navigate through the pages in the report by either clicking on the pages listed below, or by using the keyword search tool below to find specific information within the annual report.-
 1
1 -
2
-
3
-
4
-
5
-
6
-
7
-
8
-
9
-
10
-
11
-
12
-
13
-
14
-
15
-
16
-
17
-
18
-
19
-
20
-
21
-
22
-
23
-
24
-
25
-
26
-
27
-
28
-
29
-
30
-
31
-
32
-
33
-
34
-
35
-
36
-
37
-
38
-
39
-
40
-
41
-
42
-
43
-
44
-
45
-
46
-
47
-
48
-
49
-
50
-
51
-
52
-
53
-
54
-
55
-
56
-
57
-
58
-
59
-
60
-
 61
61 -
 62
62 -
 63
63 -
 64
64 -
 65
65 -
 66
66 -
 67
67 -
 68
68 -
 69
69 -
 70
70 -
 71
71 -
 72
72 -
 73
73 -
 74
74 -
 75
75 -
 76
76 -
 77
77 -
 78
78 -
 79
79 -
 80
80 -
 81
81 -
82
-
83
-
84
-
85
-
86
-
87
-
88
-
89
-
90
-
91
-
92
-
93
-
94
-
95
-
96
-
97
-
98
-
99
-
100
-
101
-
102
-
103
-
104
-
105
-
106
-
107
-
108
-
109
-
110
-
111
-
112
-
113
-
114
-
115
-
116
-
117
-
118
-
119
-
120
-
121
-
122
-
123
-
124
-
125
-
126
-
127
-
128
-
129
-
130
-
131
-
132
-
133
-
134
-
135
-
136
-
137
-
138
-
139
-
140
-
141
-
142
-
143
-
144
-
145
-
146
-
147
-
148
-
149
-
150
-
151
-
152
-
153
-
154
-
155
-
156
-
157
-
158
-
159
-
160
-
161
-
162
-
163
-
164
-
165
-
166
-
167
-
168
-
169
-
170
-
171
-
172
-
173
-
174
-
175
-
176
-
177
-
178
-
179
-
180
-
181
-
182
-
183
-
184
-
185
-
186
-
187
-
188
-
189
-
190
-
191
-
192
-
193
-
194
-
195
-
196
-
197
-
198
-
199
-
200
-
201
-
202
-
203
-
204
-
205
-
206
-
207
-
208
-
209
-
210
-
211
-
212
-
213
-
214
-
215
-
216
-
217
-
218
-
219
-
220
-
221
-
222
-
223
-
224
 |
 |

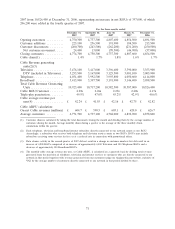
Content and sit-up segments into the combined company’s Content segment. The pro forma data has
been calculated on a basis consistent with the pro forma financial information filed with the Securities
and Exchange Commission under our Form 8-K/A on May 10, 2006. We believe that a pro forma
comparison of these segments is more relevant than a historic comparison as: (a) in respect of our
Cable segment, the size of the acquired legacy Telewest cable business would obscure any meaningful
discussion of changes in our Cable segment if viewed on a historical basis; and (b) we did not have a
Content segment prior to March 3, 2006. Comparative pro forma results of our Mobile segment have
not been presented.
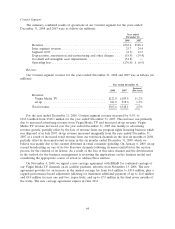
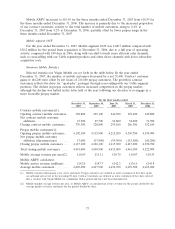
Cable Segment
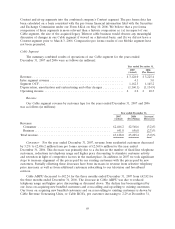
The summary combined results of operations of our Cable segment for the years ended
December 31, 2007 and 2006 were as follows (in millions):
Year ended December 31,
2007 2006
(Actual) (Pro Forma)
Revenue .................................................... £3,128.0 £ 3,225.4
Inter segment revenue .......................................... 4.1 3.0
Segment OCF ................................................ 1,162.3 1,145.2
Depreciation, amortization and restructuring and other charges ............ (1,160.1) (1,134.9)
Operating income ............................................. £ 2.2 £ 10.3
Revenue
Our Cable segment revenue by customer type for the years ended December 31, 2007 and 2006
was as follows (in millions):
Year ended December 31,
2007 2006 Increase/
(Actual) (Pro Forma) (Decrease)
Revenue:
Consumer ......................................... £2,486.2 £2,568.6 (3.2)%
Business ........................................... 641.8 656.8 (2.3)%
Total revenue ......................................... £3,128.0 £3,225.4 (3.0)%
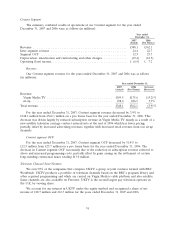
Consumer: For the year ended December 31, 2007, revenue from residential customers decreased
by 3.2% to £2,486.2 million from pro forma revenue of £2,568.6 million for the year ended
December 31, 2006. This decrease was primarily due to a decline in the number of fixed line telephone
customers, reductions in telephony usage and higher price discounting to stimulate customer activity
and retention in light of competitive factors in the marketplace. In addition, in 2007 we took significant
steps to increase alignment of the prices paid by our existing customers with the prices paid by new
customers. Partially offsetting these decreases have been increases in revenue from selective telephony
price increases as well as from additional customers subscribing to our television and broadband
services.
Cable ARPU decreased to £42.24 for the three months ended December 31, 2007 from £42.82 for
the three months ended December 31, 2006. The decrease in Cable ARPU was due to reduced
telephony usage and higher price discounting as discussed above. The decline has been mitigated by
our focus on acquiring new bundled customers and cross-selling and up-selling to existing customers.
Our focus on acquiring new bundled customers and on cross-selling to existing customers is shown by
Cable Revenue Generating Units, or Cable RGUs, per customer increasing to 2.29 at December 31,
69