Virgin Media 2008 Annual Report Download - page 46
Download and view the complete annual report
Please find page 46 of the 2008 Virgin Media annual report below. You can navigate through the pages in the report by either clicking on the pages listed below, or by using the keyword search tool below to find specific information within the annual report.-
 1
1 -
2
-
3
-
4
-
5
-
6
-
7
-
8
-
9
-
10
-
11
-
12
-
13
-
14
-
15
-
16
-
17
-
18
-
19
-
20
-
21
-
22
-
23
-
24
-
25
-
26
-
27
-
28
-
29
-
30
-
31
-
32
-
33
-
34
-
35
-
 36
36 -
 37
37 -
 38
38 -
 39
39 -
 40
40 -
 41
41 -
 42
42 -
 43
43 -
 44
44 -
 45
45 -
 46
46 -
 47
47 -
 48
48 -
 49
49 -
 50
50 -
 51
51 -
 52
52 -
 53
53 -
 54
54 -
 55
55 -
 56
56 -
57
-
58
-
59
-
60
-
61
-
62
-
63
-
64
-
65
-
66
-
67
-
68
-
69
-
70
-
71
-
72
-
73
-
74
-
75
-
76
-
77
-
78
-
79
-
80
-
81
-
82
-
83
-
84
-
85
-
86
-
87
-
88
-
89
-
90
-
91
-
92
-
93
-
94
-
95
-
96
-
97
-
98
-
99
-
100
-
101
-
102
-
103
-
104
-
105
-
106
-
107
-
108
-
109
-
110
-
111
-
112
-
113
-
114
-
115
-
116
-
117
-
118
-
119
-
120
-
121
-
122
-
123
-
124
-
125
-
126
-
127
-
128
-
129
-
130
-
131
-
132
-
133
-
134
-
135
-
136
-
137
-
138
-
139
-
140
-
141
-
142
-
143
-
144
-
145
-
146
-
147
-
148
-
149
-
150
-
151
-
152
-
153
-
154
-
155
-
156
-
157
-
158
-
159
-
160
-
161
-
162
-
163
-
164
-
165
-
166
-
167
-
168
-
169
-
170
-
171
-
172
-
173
-
174
-
175
-
176
-
177
-
178
-
179
-
180
-
181
-
182
-
183
-
184
-
185
-
186
-
187
-
188
-
189
-
190
-
191
-
192
-
193
-
194
-
195
-
196
-
197
-
198
-
199
-
200
-
201
-
202
-
203
-
204
-
205
-
206
-
207
-
208
-
209
-
210
-
211
-
212
-
213
-
214
-
215
-
216
-
217
-
218
-
219
-
220
-
221
-
222
-
223
-
224
 |
 |

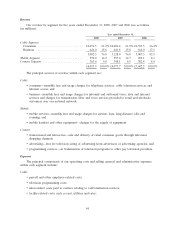
Revenue
Our revenue by segment for the years ended December 31, 2008, 2007 and 2006 was as follows
(in millions):
Year ended December 31,
2008 2007 2006
Cable Segment
Consumer .......................... £2,456.3 61.2% £2,486.2 61.0% £2,393.3 66.4%
Business ........................... 626.0 15.6 641.8 15.8 614.0 17.1
3,082.3 76.8 3,128.0 76.8 3,007.3 83.5
Mobile Segment ........................ 570.0 14.2 597.6 14.7 292.1 8.1
Content Segment ....................... 363.6 9.0 348.1 8.5 302.8 8.4
£4,015.9 100.0% £4,073.7 100.0% £3,602.2 100.0%
The principal sources of revenue within each segment are:
Cable
• consumer—monthly fees and usage charges for telephone services, cable television services and
internet access; and
• business—monthly fees and usage charges for inbound and outbound voice, data and internet
services and charges for transmission, fiber and voice services provided to retail and wholesale
customers over our national network.
Mobile
• mobile services—monthly fees and usage charges for airtime, data, long-distance calls and
roaming; and
• mobile handset and other equipment—charges for the supply of equipment.
Content
• transactional and interactive—sale and delivery of retail consumer goods through television
shopping channels;
• advertising—fees for television airing of advertising from advertisers or advertising agencies; and
• programming services—on transmission of television programs to other pay television providers.
Expenses
The principal components of our operating costs and selling, general and administrative expenses
within each segment include:
Cable
• payroll and other employee-related costs;
• television programming costs;
• interconnect costs paid to carriers relating to call termination services;
• facility-related costs, such as rent, utilities and rates;
44