Virgin Media 2008 Annual Report Download - page 190
Download and view the complete annual report
Please find page 190 of the 2008 Virgin Media annual report below. You can navigate through the pages in the report by either clicking on the pages listed below, or by using the keyword search tool below to find specific information within the annual report.-
 1
1 -
2
-
3
-
4
-
5
-
6
-
7
-
8
-
9
-
10
-
11
-
12
-
13
-
14
-
15
-
16
-
17
-
18
-
19
-
20
-
21
-
22
-
23
-
24
-
25
-
26
-
27
-
28
-
29
-
30
-
31
-
32
-
33
-
34
-
35
-
36
-
37
-
38
-
39
-
40
-
41
-
42
-
43
-
44
-
45
-
46
-
47
-
48
-
49
-
50
-
51
-
52
-
53
-
54
-
55
-
56
-
57
-
58
-
59
-
60
-
61
-
62
-
63
-
64
-
65
-
66
-
67
-
68
-
69
-
70
-
71
-
72
-
73
-
74
-
75
-
76
-
77
-
78
-
79
-
80
-
81
-
82
-
83
-
84
-
85
-
86
-
87
-
88
-
89
-
90
-
91
-
92
-
93
-
94
-
95
-
96
-
97
-
98
-
99
-
100
-
101
-
102
-
103
-
104
-
105
-
106
-
107
-
108
-
109
-
110
-
111
-
112
-
113
-
114
-
115
-
116
-
117
-
118
-
119
-
120
-
121
-
122
-
123
-
124
-
125
-
126
-
127
-
128
-
129
-
130
-
131
-
132
-
133
-
134
-
135
-
136
-
137
-
138
-
139
-
140
-
141
-
142
-
143
-
144
-
145
-
146
-
147
-
148
-
149
-
150
-
151
-
152
-
153
-
154
-
155
-
156
-
157
-
158
-
159
-
160
-
161
-
162
-
163
-
164
-
165
-
166
-
167
-
168
-
169
-
170
-
171
-
172
-
173
-
174
-
175
-
176
-
177
-
178
-
179
-
 180
180 -
 181
181 -
 182
182 -
 183
183 -
 184
184 -
 185
185 -
 186
186 -
 187
187 -
 188
188 -
 189
189 -
 190
190 -
 191
191 -
 192
192 -
 193
193 -
 194
194 -
 195
195 -
 196
196 -
 197
197 -
 198
198 -
 199
199 -
 200
200 -
201
-
202
-
203
-
204
-
205
-
206
-
207
-
208
-
209
-
210
-
211
-
212
-
213
-
214
-
215
-
216
-
217
-
218
-
219
-
220
-
221
-
222
-
223
-
224
 |
 |

VIRGIN MEDIA INVESTMENT HOLDINGS LIMITED AND SUBSIDIARIES
NOTES TO CONSOLIDATED FINANCIAL STATEMENTS (Continued)
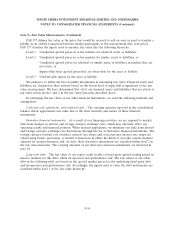
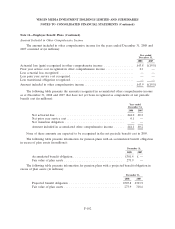
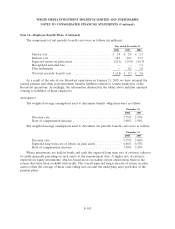
Note 9—Fair Value Measurements (Continued)
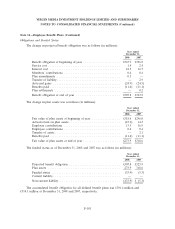
The carrying amounts and fair values of our long term debt are as follows (in millions):
December 31, 2008 December 31, 2007
Carrying Fair Carrying Fair
Amount Value Amount Value
Senior credit facility .............................. £4,189.4 £3,048.0 £4,804.8 £4,600.4
8.75% U.S. dollar loan notes due 2014 to Virgin Media
Finance PLC ................................. 290.7 246.7 214.2 221.0
9.75% Sterling loan notes due 2014 to Virgin Media
Finance PLC ................................. 375.0 292.5 375.0 358.6
8.75% Euro loan notes due 2014 to Virgin Media
Finance PLC ................................. 214.2 158.8 165.6 157.6
9.125% U.S. dollar senior notes due 2016 to Virgin Media
Finance PLC ................................. 376.2 313.1 277.2 283.7
6.50% U.S. Dollar loan notes due 2016 due to Virgin Media
Finance PLC ................................. 507.0 226.1 — —
6.50% U.S. Dollar loan notes due 2016 due to Virgin Media
(UK) Group Inc ............................... 164.1 73.2 — —
Floating rate loan notes due 2012 to Virgin Media
Finance PLC ................................. 68.4 68.4 50.4 50.4
Other loan notes due to affiliates .................... 472.5 472.5 284.7 284.7
Concentrations of Credit Risk
Our financial instruments that are exposed to concentrations of credit risk consist primarily of
cash, trade receivables and derivative contracts.
At December 31, 2008 and 2007, we had approximately £170.7 million and £310.0 million,
respectively, in cash and cash equivalents. These cash and cash equivalents are on deposit with major
financial institutions and, as part of our cash management process, we perform regular evaluations of
the credit standing of these institutions using a range of metrics. We have not experienced any losses in
cash balances and do not believe we are exposed to any significant credit risk on our cash balances.
Concentrations of credit risk with respect to trade receivables are limited because of the large
number of customers and their dispersion across geographic areas. We perform periodic credit
evaluations of our Business customers’ financial condition and generally do not require collateral. No
single group or customer represents greater than 10% of total accounts receivable.
Concentrations of credit risk with respect to derivative contracts are focused within a limited
number of international financial institutions with which we operate and relate only to derivatives with
recorded asset balances at December 31, 2008. We perform regular reviews of the financial institutions
with which we operate as to their credit worthiness and financial condition. We have not experienced
non-performance by any of our derivative counterparties nor do we expect there to be non-performance
risks associated with our counterparties. At December 31, 2008, based on market values, we had 54.4%
of our derivative contracts with three financial institutions, each with more than 10% of our total
exposure. At December 31, 2007, we had 74.8% of our contracts by market value with four financial
institutions, each with more than 10% of our total exposure.
F-96