Virgin Media 2008 Annual Report Download - page 43
Download and view the complete annual report
Please find page 43 of the 2008 Virgin Media annual report below. You can navigate through the pages in the report by either clicking on the pages listed below, or by using the keyword search tool below to find specific information within the annual report.-
 1
1 -
2
-
3
-
4
-
5
-
6
-
7
-
8
-
9
-
10
-
11
-
12
-
13
-
14
-
15
-
16
-
17
-
18
-
19
-
20
-
21
-
22
-
23
-
24
-
25
-
26
-
27
-
28
-
29
-
30
-
31
-
32
-
 33
33 -
 34
34 -
 35
35 -
 36
36 -
 37
37 -
 38
38 -
 39
39 -
 40
40 -
 41
41 -
 42
42 -
 43
43 -
 44
44 -
 45
45 -
 46
46 -
 47
47 -
 48
48 -
 49
49 -
 50
50 -
 51
51 -
 52
52 -
 53
53 -
54
-
55
-
56
-
57
-
58
-
59
-
60
-
61
-
62
-
63
-
64
-
65
-
66
-
67
-
68
-
69
-
70
-
71
-
72
-
73
-
74
-
75
-
76
-
77
-
78
-
79
-
80
-
81
-
82
-
83
-
84
-
85
-
86
-
87
-
88
-
89
-
90
-
91
-
92
-
93
-
94
-
95
-
96
-
97
-
98
-
99
-
100
-
101
-
102
-
103
-
104
-
105
-
106
-
107
-
108
-
109
-
110
-
111
-
112
-
113
-
114
-
115
-
116
-
117
-
118
-
119
-
120
-
121
-
122
-
123
-
124
-
125
-
126
-
127
-
128
-
129
-
130
-
131
-
132
-
133
-
134
-
135
-
136
-
137
-
138
-
139
-
140
-
141
-
142
-
143
-
144
-
145
-
146
-
147
-
148
-
149
-
150
-
151
-
152
-
153
-
154
-
155
-
156
-
157
-
158
-
159
-
160
-
161
-
162
-
163
-
164
-
165
-
166
-
167
-
168
-
169
-
170
-
171
-
172
-
173
-
174
-
175
-
176
-
177
-
178
-
179
-
180
-
181
-
182
-
183
-
184
-
185
-
186
-
187
-
188
-
189
-
190
-
191
-
192
-
193
-
194
-
195
-
196
-
197
-
198
-
199
-
200
-
201
-
202
-
203
-
204
-
205
-
206
-
207
-
208
-
209
-
210
-
211
-
212
-
213
-
214
-
215
-
216
-
217
-
218
-
219
-
220
-
221
-
222
-
223
-
224
 |
 |
24FEB200919222279
subsidiaries’ existing and future indebtedness and the laws of jurisdictions under which those
subsidiaries are organized limit the payment of dividends, loan repayments and other distributions to us
under many circumstances.
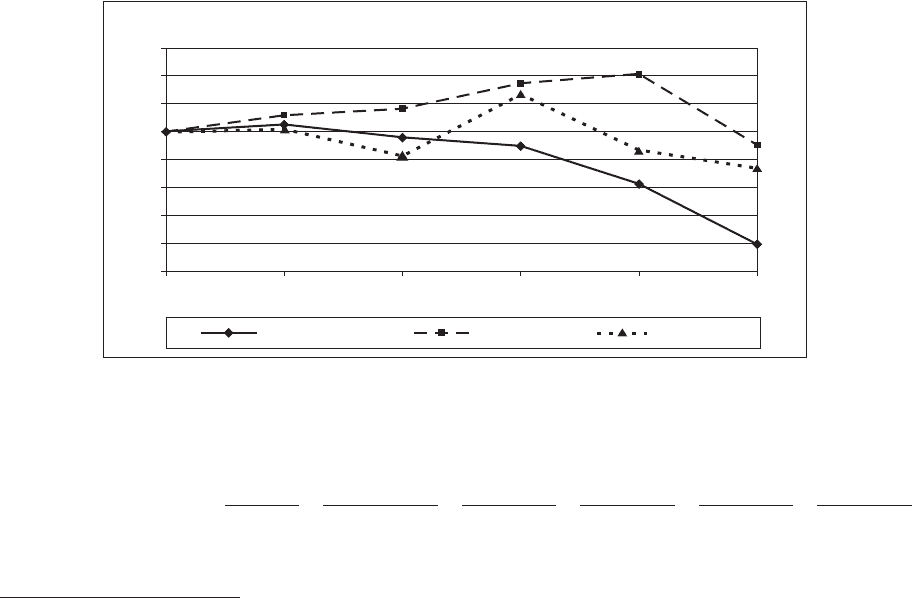
Stock Performance Graph
The following graph compares the cumulative total return on our common stock with the
cumulative total return on Standard & Poor’s 500 Stock Index and a Peer Group Index. As no
published index of comparable companies currently reports values on a dividends reinvested basis, we
have created a Peer Group Index for purposes of this graph in accordance with the requirements of the
SEC. The Peer Group Index is made up of companies that engage in cable television operations and
related businesses as a significant element of their overall business, although not all of the companies
included in the Peer Group Index participate in all of the lines of business in which we are engaged
and some of the companies included in the Peer Group Index also engage in lines of business in which
we do not participate. In addition, the market capitalizations of many of the companies included in the
Peer Group Index are different from ours.
Furthermore, all of the companies included in the Peer Group Index are U.S. based, whereas our
operations are exclusively based in the U.K. and our U.S. dollar performance is significantly influenced
by exchange rate changes. The common stocks of the following companies have been included in the
Peer Group Index: Comcast Corporation, Cablevision Systems Corporation and Time Warner
Cable Inc.
Comparison of Cumulative Total Return
$0
$20
$40
$60
$80
$100
$120
$140
$160
01/01/2004 12/31/2008
Virgin Media S&P 500 Peer Group
12/31/2004 12/31/200712/31/200612/31/2005
The graph assumes that $100 was invested on January 1, 2004 and all dividends are reinvested.
Total Returns
January 1, December 31, December 31, December 31, December 31, December 31,
2004 2004 2005 2006 2007 2008
Virgin Media(1) ..... 100.00 104.60 97.61 90.64 61.91 18.35
S&P 500 .......... 100.00 110.88 116.33 134.70 142.10 89.53
Peer Group ........ 100.00 102.00 81.95 128.24 86.32 73.99
(1) Share prices from January 1, 2004 through March 3, 2006 reflect the historic prices of the common stock of NTL
Incorporated prior to its merger into a subsidiary of Telewest Global, Inc., in a transaction that was accounted for as a
reverse acquisition. The new holding company, Telewest Global, Inc., changed its name to NTL Incorporated on March 3,
2006. From March 6, 2006, share prices reflect the market price for that company, which was renamed Virgin Media Inc. on
February 6, 2007.
41