Virgin Media 2008 Annual Report Download - page 61
Download and view the complete annual report
Please find page 61 of the 2008 Virgin Media annual report below. You can navigate through the pages in the report by either clicking on the pages listed below, or by using the keyword search tool below to find specific information within the annual report.-
 1
1 -
2
-
3
-
4
-
5
-
6
-
7
-
8
-
9
-
10
-
11
-
12
-
13
-
14
-
15
-
16
-
17
-
18
-
19
-
20
-
21
-
22
-
23
-
24
-
25
-
26
-
27
-
28
-
29
-
30
-
31
-
32
-
33
-
34
-
35
-
36
-
37
-
38
-
39
-
40
-
41
-
42
-
43
-
44
-
45
-
46
-
47
-
48
-
49
-
50
-
 51
51 -
 52
52 -
 53
53 -
 54
54 -
 55
55 -
 56
56 -
 57
57 -
 58
58 -
 59
59 -
 60
60 -
 61
61 -
 62
62 -
 63
63 -
 64
64 -
 65
65 -
 66
66 -
 67
67 -
 68
68 -
 69
69 -
 70
70 -
 71
71 -
72
-
73
-
74
-
75
-
76
-
77
-
78
-
79
-
80
-
81
-
82
-
83
-
84
-
85
-
86
-
87
-
88
-
89
-
90
-
91
-
92
-
93
-
94
-
95
-
96
-
97
-
98
-
99
-
100
-
101
-
102
-
103
-
104
-
105
-
106
-
107
-
108
-
109
-
110
-
111
-
112
-
113
-
114
-
115
-
116
-
117
-
118
-
119
-
120
-
121
-
122
-
123
-
124
-
125
-
126
-
127
-
128
-
129
-
130
-
131
-
132
-
133
-
134
-
135
-
136
-
137
-
138
-
139
-
140
-
141
-
142
-
143
-
144
-
145
-
146
-
147
-
148
-
149
-
150
-
151
-
152
-
153
-
154
-
155
-
156
-
157
-
158
-
159
-
160
-
161
-
162
-
163
-
164
-
165
-
166
-
167
-
168
-
169
-
170
-
171
-
172
-
173
-
174
-
175
-
176
-
177
-
178
-
179
-
180
-
181
-
182
-
183
-
184
-
185
-
186
-
187
-
188
-
189
-
190
-
191
-
192
-
193
-
194
-
195
-
196
-
197
-
198
-
199
-
200
-
201
-
202
-
203
-
204
-
205
-
206
-
207
-
208
-
209
-
210
-
211
-
212
-
213
-
214
-
215
-
216
-
217
-
218
-
219
-
220
-
221
-
222
-
223
-
224
 |
 |
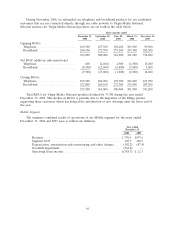
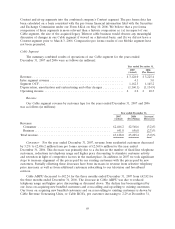
result of declining telephony usage, as a result of which our strategy has been to replace this declining
voice revenue with increasing data revenue. Retail data revenue represented 43.1% of the retail
business revenue for the year ended December 31, 2008 compared with 37.7% for the year ended
December 31, 2007.
Other retail revenue in the year ended December 31, 2008 was £61.6 million compared to
£67.3 million for the year ended December 31, 2007. The majority of this revenue is from infrastructure
projects which are non-recurring in nature. Our largest infrastructure project has been the provision of
telecoms network equipment for Heathrow airport’s new Terminal 5 which contributed £21.0 million of
revenue in the year ended December 31, 2008 compared to £27.9 million in the year ended
December 31, 2007. This contract, however, operates at a lower margin and, consequently, it does not
have a significant impact on Cable segment OCF.
Wholesale revenue decreased mainly as a result of fewer customers in a highly competitive market
partly offset by £2.5 million of stronger than usual customer equipment sales in the last three months
of the year.
Cable segment OCF
For the year ended December 31, 2008, Cable segment OCF increased to £1,199.0 million from
£1,162.3 million for the year ended December 31, 2007. This increase is partly due to lower selling,
general and administrative expenses as a result of a reduction in marketing costs after our rebrand to
Virgin Media in 2007 together with lower employee related costs, and lower direct operating costs as a
result of lower revenues. Partially offsetting these savings were lower consumer revenue, primarily as a
result of higher price discounting and lower telephony usage, together with the decline in revenue from
business customers, as described above.
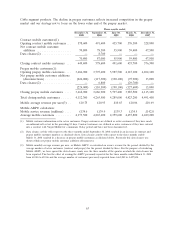
Summary Cable Statistics
Selected statistics for residential cable customers of Virgin Media, excluding customers off our
network and Virgin Mobile customers, for the three months ended December 31, 2008 as well as the
four prior quarters, are set forth in the table below. Our net customer movement for the three months
ended December 31, 2008 was an increase of 14,800 customers being the net of gross additions and
disconnections (net additions). The reduction in net additions compared with the three months ended
December 31, 2007 was primarily the result of fewer gross additions which we believe may be due in
part to the softer macroeconomic environment. Customer churn fell during recent periods, particularly
in the three months ended March 31, 2008, June 30, 2008, September 30, 2008 and December 31, 2008
during which our average monthly churn was 1.2%, 1.3%, 1.5% and 1.2%, respectively. These rates
compare with the three months ended March 31, 2007, June 30, 2007, September 30, 2007 and
December 31, 2007, during which our average monthly churn was 1.6%, 1.8%, 1.7% and 1.4%,
59