Virgin Media 2008 Annual Report Download - page 59
Download and view the complete annual report
Please find page 59 of the 2008 Virgin Media annual report below. You can navigate through the pages in the report by either clicking on the pages listed below, or by using the keyword search tool below to find specific information within the annual report.-
 1
1 -
2
-
3
-
4
-
5
-
6
-
7
-
8
-
9
-
10
-
11
-
12
-
13
-
14
-
15
-
16
-
17
-
18
-
19
-
20
-
21
-
22
-
23
-
24
-
25
-
26
-
27
-
28
-
29
-
30
-
31
-
32
-
33
-
34
-
35
-
36
-
37
-
38
-
39
-
40
-
41
-
42
-
43
-
44
-
45
-
46
-
47
-
48
-
 49
49 -
 50
50 -
 51
51 -
 52
52 -
 53
53 -
 54
54 -
 55
55 -
 56
56 -
 57
57 -
 58
58 -
 59
59 -
 60
60 -
 61
61 -
 62
62 -
 63
63 -
 64
64 -
 65
65 -
 66
66 -
 67
67 -
 68
68 -
 69
69 -
70
-
71
-
72
-
73
-
74
-
75
-
76
-
77
-
78
-
79
-
80
-
81
-
82
-
83
-
84
-
85
-
86
-
87
-
88
-
89
-
90
-
91
-
92
-
93
-
94
-
95
-
96
-
97
-
98
-
99
-
100
-
101
-
102
-
103
-
104
-
105
-
106
-
107
-
108
-
109
-
110
-
111
-
112
-
113
-
114
-
115
-
116
-
117
-
118
-
119
-
120
-
121
-
122
-
123
-
124
-
125
-
126
-
127
-
128
-
129
-
130
-
131
-
132
-
133
-
134
-
135
-
136
-
137
-
138
-
139
-
140
-
141
-
142
-
143
-
144
-
145
-
146
-
147
-
148
-
149
-
150
-
151
-
152
-
153
-
154
-
155
-
156
-
157
-
158
-
159
-
160
-
161
-
162
-
163
-
164
-
165
-
166
-
167
-
168
-
169
-
170
-
171
-
172
-
173
-
174
-
175
-
176
-
177
-
178
-
179
-
180
-
181
-
182
-
183
-
184
-
185
-
186
-
187
-
188
-
189
-
190
-
191
-
192
-
193
-
194
-
195
-
196
-
197
-
198
-
199
-
200
-
201
-
202
-
203
-
204
-
205
-
206
-
207
-
208
-
209
-
210
-
211
-
212
-
213
-
214
-
215
-
216
-
217
-
218
-
219
-
220
-
221
-
222
-
223
-
224
 |
 |

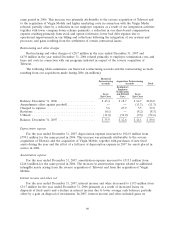
Loss from continuing operations
For the year ended December 31, 2008, loss from continuing operations increased to £913.8 million
from a loss of £463.5 million for the same period in 2007 due to the factors discussed above.
Loss from continuing operations per share
Basic and diluted loss from continuing operations per common share for the year ended
December 31, 2008 was £2.79 compared to £1.42 for the year ended December 31, 2007. Basic and
diluted loss per share is computed using a weighted average of 328.0 million shares issued and
outstanding in the year ended December 31, 2008 and a weighted average of 325.9 million shares
issued and outstanding for the same period in 2007. Options, warrants, shares issuable under the
convertible senior notes and shares of restricted stock held in escrow outstanding at December 31, 2008
and 2007 are excluded from the calculation of diluted loss per share, since these securities are
anti-dilutive.
Segmental Results of Operations for the Years Ended December 31, 2008 and 2007
A description of the products and services, as well as financial data, for each segment can be
found in note 18 to the consolidated financial statements of Virgin Media Inc. The reportable segments
disclosed in this annual report are based on our management organizational structure as of
December 31, 2008. Future changes to this organizational structure may result in changes to the
reportable segments disclosed.
Segment operating income before depreciation, amortization, restructuring and other charges and
goodwill and intangible asset impairments, which we refer to as Segment OCF, is management’s
measure of segment profit as permitted under FASB Statement No. 131, Disclosures about Segments of
an Enterprise and Related Information. Our management, including our chief executive officer who is
our chief operating decision maker, considers Segment OCF as an important indicator of the
operational strength and performance of our segments. Restructuring and other charges are excluded
from Segment OCF as management believes they are not characteristic of our underlying business
operations.
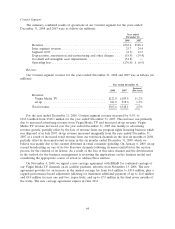
Cable Segment
The summary combined results of operations of our Cable segment for the years ended
December 31, 2008 and 2007 were as follows (in millions):
Year ended December 31,
2008 2007
Revenue ..................................................... £3,082.3 £ 3,128.0
Inter segment revenue ........................................... 3.2 4.1
Segment OCF ................................................. 1,199.0 1,162.3
Depreciation, amortization and restructuring and other charges ............. (1,103.6) (1,160.1)
Operating income .............................................. £ 95.4 £ 2.2
57