Virgin Media 2008 Annual Report Download - page 52
Download and view the complete annual report
Please find page 52 of the 2008 Virgin Media annual report below. You can navigate through the pages in the report by either clicking on the pages listed below, or by using the keyword search tool below to find specific information within the annual report.-
 1
1 -
2
-
3
-
4
-
5
-
6
-
7
-
8
-
9
-
10
-
11
-
12
-
13
-
14
-
15
-
16
-
17
-
18
-
19
-
20
-
21
-
22
-
23
-
24
-
25
-
26
-
27
-
28
-
29
-
30
-
31
-
32
-
33
-
34
-
35
-
36
-
37
-
38
-
39
-
40
-
41
-
 42
42 -
 43
43 -
 44
44 -
 45
45 -
 46
46 -
 47
47 -
 48
48 -
 49
49 -
 50
50 -
 51
51 -
 52
52 -
 53
53 -
 54
54 -
 55
55 -
 56
56 -
 57
57 -
 58
58 -
 59
59 -
 60
60 -
 61
61 -
 62
62 -
63
-
64
-
65
-
66
-
67
-
68
-
69
-
70
-
71
-
72
-
73
-
74
-
75
-
76
-
77
-
78
-
79
-
80
-
81
-
82
-
83
-
84
-
85
-
86
-
87
-
88
-
89
-
90
-
91
-
92
-
93
-
94
-
95
-
96
-
97
-
98
-
99
-
100
-
101
-
102
-
103
-
104
-
105
-
106
-
107
-
108
-
109
-
110
-
111
-
112
-
113
-
114
-
115
-
116
-
117
-
118
-
119
-
120
-
121
-
122
-
123
-
124
-
125
-
126
-
127
-
128
-
129
-
130
-
131
-
132
-
133
-
134
-
135
-
136
-
137
-
138
-
139
-
140
-
141
-
142
-
143
-
144
-
145
-
146
-
147
-
148
-
149
-
150
-
151
-
152
-
153
-
154
-
155
-
156
-
157
-
158
-
159
-
160
-
161
-
162
-
163
-
164
-
165
-
166
-
167
-
168
-
169
-
170
-
171
-
172
-
173
-
174
-
175
-
176
-
177
-
178
-
179
-
180
-
181
-
182
-
183
-
184
-
185
-
186
-
187
-
188
-
189
-
190
-
191
-
192
-
193
-
194
-
195
-
196
-
197
-
198
-
199
-
200
-
201
-
202
-
203
-
204
-
205
-
206
-
207
-
208
-
209
-
210
-
211
-
212
-
213
-
214
-
215
-
216
-
217
-
218
-
219
-
220
-
221
-
222
-
223
-
224
 |
 |

include inherent uncertainties, including those relating to the timing and amount of future cash flows
and the discount rate used in the calculation. Assumptions used in these cash flow projections are
consistent with our internal forecasts. If actual results differ from the assumptions used in the
impairment review, we may incur additional impairment charges in the future. Assumptions made about
increased competition and a further slowdown in the economy on a longer term basis could impact the
valuation to be used in future annual impairment testing.
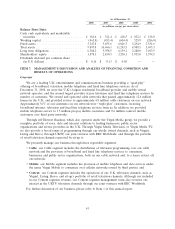
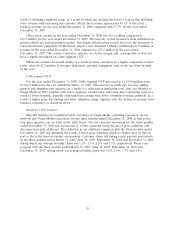
The table below illustrates the hypothetical impairment loss related to our reporting units if the
fair value of those reporting units had declined from the amount calculated at the time of our latest
annual or interim impairment test by the following percentages (in millions):
Percentage Decline in Fair Value and
Related Hypothetical Impairment(1)
5% 10% 15% 20%
Cable .............................................. — £(182.0) £(533.0) £(884.0)
Mobile ............................................. — — — £ (2.1)
Virgin Media TV ..................................... — — — —
sit-up .............................................. — — — —
(1) Hypothetical impairment represents the amount by which the carrying value would exceed the fair value of the reporting
unit.
Fixed Assets
Labor and overhead costs directly related to the construction and installation of fixed assets,
including payroll and related costs of some employees and related rent and other occupancy costs, are
capitalized. The payroll and related costs of some employees that are directly related to construction
and installation activities are capitalized based on specific time devoted to these activities where
identifiable. In cases where the time devoted to these activities is not specifically identifiable, we
capitalize costs based upon estimated allocations. Costs associated with initial customer installations are
capitalized. The costs of reconnecting the same service to a previously installed premise are charged to
expense in the period incurred. Costs for repairs and maintenance are charged to expense as incurred.
We assign fixed assets and intangible assets useful lives that impact the annual depreciation and
amortization expense. The assignment of useful lives involves significant judgments and the use of
estimates. Our management use their experience and expertise in applying judgments about appropriate
estimates. Changes in technology or changes in intended use of these assets may cause the estimated
useful life to change, resulting in higher or lower depreciation charges or asset impairment charges.
Costs Associated with Construction and Installation Activities
Installation revenues are recognized in accordance with the provisions of FASB Statement No. 51,
Financial Reporting by Cable Television Companies, in relation to connection and activation fees for
cable television, as well as fixed line telephone and broadband internet services, on the basis that we
market and maintain a unified fiber network through which we provide all of these services. Installation
revenues are recognized at the time the installation has been completed to the extent that those fees
are less than direct selling costs. Installation fees in excess of direct selling costs are deferred and
amortized over the expected life of the customer’s connection.
The nature and amount of labor and other costs to be capitalized with respect to construction and
installation activities involves significant judgment. In addition to direct external and internal labor and
materials, we also capitalize other costs directly attributable to our construction and installation
activities. We continuously monitor the appropriateness of our capitalization policy and update the
policy when necessary to respond to changes in facts and circumstances, such as the development of
50