Tesco 2008 Annual Report Download - page 99
Download and view the complete annual report
Please find page 99 of the 2008 Tesco annual report below. You can navigate through the pages in the report by either clicking on the pages listed below, or by using the keyword search tool below to find specific information within the annual report.-
 1
1 -
2
-
3
-
4
-
5
-
6
-
7
-
8
-
9
-
10
-
11
-
12
-
13
-
14
-
15
-
16
-
17
-
18
-
19
-
20
-
21
-
22
-
23
-
24
-
25
-
26
-
27
-
28
-
29
-
30
-
31
-
32
-
33
-
34
-
35
-
36
-
37
-
38
-
39
-
40
-
41
-
42
-
43
-
44
-
45
-
46
-
47
-
48
-
49
-
50
-
51
-
52
-
53
-
54
-
55
-
56
-
57
-
58
-
59
-
60
-
61
-
62
-
63
-
64
-
65
-
66
-
67
-
68
-
69
-
70
-
71
-
72
-
73
-
74
-
75
-
76
-
77
-
78
-
79
-
80
-
81
-
82
-
83
-
84
-
85
-
86
-
87
-
88
-
 89
89 -
 90
90 -
 91
91 -
 92
92 -
 93
93 -
 94
94 -
 95
95 -
 96
96 -
 97
97 -
 98
98 -
 99
99 -
 100
100 -
 101
101 -
 102
102 -
 103
103 -
 104
104 -
 105
105 -
 106
106 -
 107
107 -
 108
108 -
 109
109 -
110
-
111
-
112
 |
 |

Tesco PLC Annual Report and
Financial Statements 2008 97
UK GAAP IFRS
2004 2005 2005 200612007 2008
53 wks
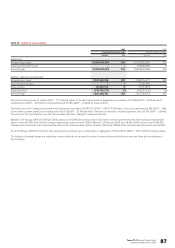
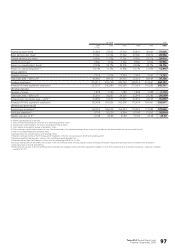
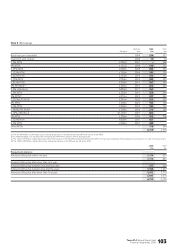
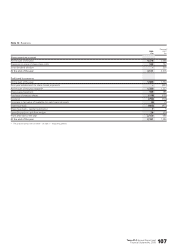
Enterprise value6(£m) 23,866 27,853 27,910 30,841 40,469 37,656
Basic earnings per share715.05p 17.72p 17.52p 20.20p 23.61p 26.95p
Diluted earnings per share714.93p 17.50p 17.30p 19.92p 23.31p 26.61p
Dividend per share86.84p 7.56p 7.56p 8.63p 9.64p 10.90p
Return on shareholders’ funds921.8% 22.7% 23.2% 24.9% 26.7% 25.1%
Return on capital employed10 10.4% 11.5% 11.8% 12.7% 12.6%15 12.9%16
Group statistics
Number of stores 2,318 2,334 2,334 2,672 3,263 3,751
Total sales area – 000 sq ft11 45,402 49,135 49,135 55,215 68,189 76,338
Average employees 310,411 335,750 335,750 368,213 413,061 444,127
Average full-time equivalent employees 223,335 242,980 242,980 273,024 318,283 345,737
UK retail statistics
Number of stores 1,878 1,780 1,780 1,898 1,988 2,115
Total sales area – 000 sq ft11 23,291 24,207 24,207 25,919 27,785 29,549
Average store size (sales area – sq ft)12 30,890 31,677 31,677 32,816 34,209 35,055
Average full-time equivalent employees 152,408 163,006 163,006 175,459 184,461 193,917
UK retail productivity (£)
Revenue per employee13 162,459 166,534 166,534 170,923 177,084 179,840
Profit per employee13 9,750 10,220 9,564 10,190 11,292 10,814
Weekly sales per sq ft14 22.48 23.89 23.89 25.06 25.48 25.43
6 Market capitalisation plus net debt.
7 Basic and diluted earnings per share are on a continuing operations basis.
8 Dividend per share relating to the interim and proposed final dividend.
9 Profit before tax divided by average shareholders’ funds.
10 The numerator is profit before interest, less tax. The denominator is the calculated average of net assets plus net debt plus dividend creditor less net assets held for sale.
11 Store sizes exclude lobby and restaurant areas.
12 Average store size excludes Express and One Stop stores.
13 Based on average number of full-time equivalent employees in the UK, revenue exclusive of VAT and operating profit.
14 Based on weighted average sales area and sales excluding property development.
15 Excludes one-off gain from ‘Pensions A-Day’, with this one-off gain ROCE was 13.6%.
16 Using a ‘normalised’ tax rate before start-up costs in the US and Tesco Direct and excluding the impact of foreign exchange in equity and our acquisition of a majority share of Dobbies.
17 Excluding stores in the US and Dobbies.
18 Excluding start-up costs in the US and Tesco Direct and adjusting average number of full-time equivalent employees in the UK to exclude US and Tesco Direct employees - profit per employee
would be £11,317.
17
17
17
18