Tesco 2008 Annual Report Download - page 59
Download and view the complete annual report
Please find page 59 of the 2008 Tesco annual report below. You can navigate through the pages in the report by either clicking on the pages listed below, or by using the keyword search tool below to find specific information within the annual report.-
 1
1 -
2
-
3
-
4
-
5
-
6
-
7
-
8
-
9
-
10
-
11
-
12
-
13
-
14
-
15
-
16
-
17
-
18
-
19
-
20
-
21
-
22
-
23
-
24
-
25
-
26
-
27
-
28
-
29
-
30
-
31
-
32
-
33
-
34
-
35
-
36
-
37
-
38
-
39
-
40
-
41
-
42
-
43
-
44
-
45
-
46
-
47
-
48
-
 49
49 -
 50
50 -
 51
51 -
 52
52 -
 53
53 -
 54
54 -
 55
55 -
 56
56 -
 57
57 -
 58
58 -
 59
59 -
 60
60 -
 61
61 -
 62
62 -
 63
63 -
 64
64 -
 65
65 -
 66
66 -
 67
67 -
 68
68 -
 69
69 -
70
-
71
-
72
-
73
-
74
-
75
-
76
-
77
-
78
-
79
-
80
-
81
-
82
-
83
-
84
-
85
-
86
-
87
-
88
-
89
-
90
-
91
-
92
-
93
-
94
-
95
-
96
-
97
-
98
-
99
-
100
-
101
-
102
-
103
-
104
-
105
-
106
-
107
-
108
-
109
-
110
-
111
-
112
 |
 |

Tesco PLC Annual Report and
Financial Statements 2008 57
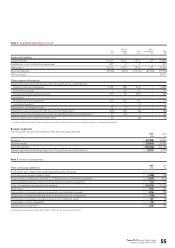
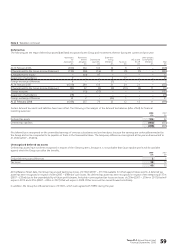
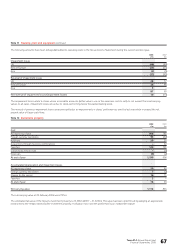
Note 5 Finance income and costs
2008 2007
£m £m
Finance income
Bank interest receivable and similar income on cash and cash equivalents 91 56
Net pension finance income (note 24) 47 34
Total finance income (on historical cost basis) 138 90
IAS 32 and IAS 39 ‘Financial instruments’ – Fair value remeasurements 49 –
Total finance income 187 90
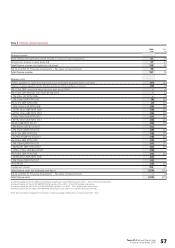
Finance costs
Interest payable on short-term bank loans and overdrafts repayable within five years (47) (34)
Finance charges payable under finance leases and hire purchase contracts (13) (7)
4% 125m GBP unsecured deep discount loan stock 2006(a) –(5)
6% 150m GBP Medium Term Note (MTN) 2006 –(7)
0.7% 50bn JPY MTN 2006 –(1)
7.5% 258m GBP MTN 2007 (8) (22)
6% 125m GBP MTN 2008 (7) (11)
5.25% 500m EUR MTN 2008 (18) (18)
5.125% 192m GBP MTN 2009 (10) (13)
6.625% 150m GBP MTN 2010 (10) (10)
4.75% 750m EUR MTN 2010 (25) (25)
3.875% 500m EUR MTN 2011 (13) (12)
4% RPI GBP MTN 2016(b) (20) (16)
5.5% 850m USD Bond 2017 (12) –
5.5% 350m GBP MTN 2019 (19) (19)
5% 415m GBP MTN 2023 (18) (16)
3.322% LPI GBP MTN 2025(c) (19) (15)
6% 200m GBP MTN 2029 (12) (12)
5.5% 200m GBP MTN 2033 (11) (11)
1.982% RPI GBP MTN 2036(d) (11) (11)
6.15% 1,150m USD Bond 2037 (18) –
5% 300m GBP MTN 2042 (15) (14)
5.125% 600m EUR MTN 2047 (21) –
5.2% 500m GBP MTN 2057 (13) –
Other MTNs (13) (11)
Capitalised interest 103 78
Total finance costs (on historical cost basis) (250) (212)
IAS 32 and IAS 39 ‘Financial Instruments’ – Fair value remeasurements –(4)
Total finance costs (250) (216)
(a) Interest payable on the 4% GBP unsecured deep discount loan stock 2006 includes £nil (2007 – £3m) of discount amortisation.
(b) Interest payable on the 4% RPI GBP MTN 2016 includes £10m (2007 – £7m) of RPI related amortisation.
(c) Interest payable on the 3.322% LPI GBP MTN 2025 includes £11m (2007 – £7m) of RPI related amortisation.
(d) Interest payable on the 1.982% RPI GBP MTN 2036 includes £7m (2007 – £7m) of RPI related amortisation.
There were no amounts recognised in finance costs relating to hedge ineffectiveness during the year (2007 – £nil).