Tesco 2008 Annual Report Download - page 87
Download and view the complete annual report
Please find page 87 of the 2008 Tesco annual report below. You can navigate through the pages in the report by either clicking on the pages listed below, or by using the keyword search tool below to find specific information within the annual report.-
 1
1 -
2
-
3
-
4
-
5
-
6
-
7
-
8
-
9
-
10
-
11
-
12
-
13
-
14
-
15
-
16
-
17
-
18
-
19
-
20
-
21
-
22
-
23
-
24
-
25
-
26
-
27
-
28
-
29
-
30
-
31
-
32
-
33
-
34
-
35
-
36
-
37
-
38
-
39
-
40
-
41
-
42
-
43
-
44
-
45
-
46
-
47
-
48
-
49
-
50
-
51
-
52
-
53
-
54
-
55
-
56
-
57
-
58
-
59
-
60
-
61
-
62
-
63
-
64
-
65
-
66
-
67
-
68
-
69
-
70
-
71
-
72
-
73
-
74
-
75
-
76
-
 77
77 -
 78
78 -
 79
79 -
 80
80 -
 81
81 -
 82
82 -
 83
83 -
 84
84 -
 85
85 -
 86
86 -
 87
87 -
 88
88 -
 89
89 -
 90
90 -
 91
91 -
 92
92 -
 93
93 -
 94
94 -
 95
95 -
 96
96 -
 97
97 -
98
-
99
-
100
-
101
-
102
-
103
-
104
-
105
-
106
-
107
-
108
-
109
-
110
-
111
-
112
 |
 |

Tesco PLC Annual Report and
Financial Statements 2008 85
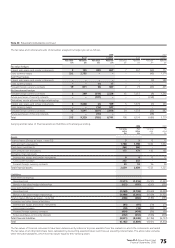
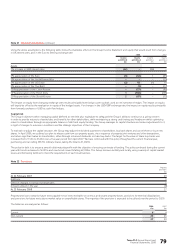
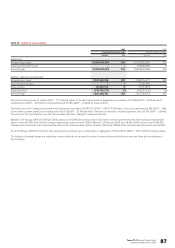
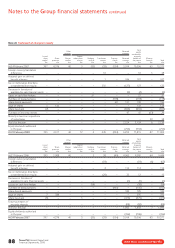
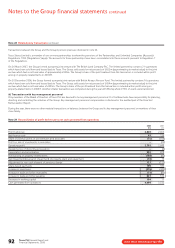
Note 24 Post-employment benefits continued
Changes in the present value of defined benefit obligations are as follows:
2008 2007 2006
£m £m £m
Opening defined benefit obligation (4,957) (4,659) (3,453)
Current service cost (461) (466) (328)
Interest cost (254) (221) (184)
Gain/(loss) on change of assumptions 672 71 (727)
Experience losses (21) (41) (24)
Foreign currency translation differences (8) 4 (1)
Benefits paid 112 104 64
Actual member contributions (7) (7) (6)
Past service gains –258 –
Acquisitions (3) ––
Closing defined benefit obligation (4,927) (4,957) (4,659)
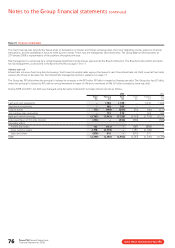
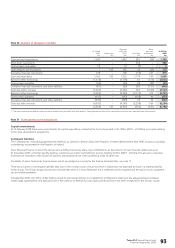
The amounts that have been charged to the Group Income Statement and Group Statement of Recognised Income and Expense for the year ended
23 February 2008 are set out below:
2008 2007 2006
£m £m £m
Analysis of the amount (charged)/credited to operating profit:
Current service cost (461) (466) (328)
Past service gains –258 –
Total charge to operating profit (461) (208) (328)
Analysis of the amount credited/(charged) to finance income:
Expected return on pension schemes’ assets 301 255 209
Interest on pension schemes’ liabilities (254) (221) (184)
Net pension finance income (note 5) 47 34 25
Total charge to the Group Income Statement (414) (174) (303)
In 2007, in line with changes to the Finance Act 2006, the scheme rules were amended from 6 April 2006 to allow employees to commute (convert)
a larger proportion of their pension for a cash lump sum at retirement. Accordingly, the assumptions made in calculating the Group’s defined benefit
pension liability have been revised, resulting in a gain of £250m being recognised in Group operating profit in 2006/7. Revisions to this assumption will
be reflected in the Group Statement of Recognised Income and Expense. Changes to scheme rules in the Republic of Ireland affecting early retirement
have reduced pension liabilities by a further £8m, which was also shown as a past service gain in the Group Income Statement in 2006/7.
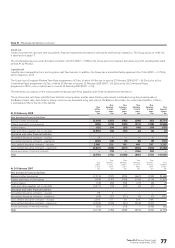
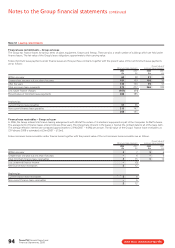
2008 2007 2006
£m £m £m
Analysis of the amount recognised in the Group Statement of Recognised Income and Expense:
Actual return less expected return on pension schemes’ assets (465) 82 309
Experience losses arising on the schemes’ liabilities (21) (41) (24)
Currency gain/(loss) 12 (1)
Changes in assumptions underlying the present value of the schemes’ liabilities 672 71 (727)
Total gain/(loss) recognised in the Group Statement of Recognised Income and Expense 187 114 (443)
The cumulative losses recognised through the Group Statement of Recognised Income and Expense since the date of transition to IFRS are £372m
(2007 – £559m).