Tesco 2008 Annual Report Download - page 69
Download and view the complete annual report
Please find page 69 of the 2008 Tesco annual report below. You can navigate through the pages in the report by either clicking on the pages listed below, or by using the keyword search tool below to find specific information within the annual report.-
 1
1 -
2
-
3
-
4
-
5
-
6
-
7
-
8
-
9
-
10
-
11
-
12
-
13
-
14
-
15
-
16
-
17
-
18
-
19
-
20
-
21
-
22
-
23
-
24
-
25
-
26
-
27
-
28
-
29
-
30
-
31
-
32
-
33
-
34
-
35
-
36
-
37
-
38
-
39
-
40
-
41
-
42
-
43
-
44
-
45
-
46
-
47
-
48
-
49
-
50
-
51
-
52
-
53
-
54
-
55
-
56
-
57
-
58
-
 59
59 -
 60
60 -
 61
61 -
 62
62 -
 63
63 -
 64
64 -
 65
65 -
 66
66 -
 67
67 -
 68
68 -
 69
69 -
 70
70 -
 71
71 -
 72
72 -
 73
73 -
 74
74 -
 75
75 -
 76
76 -
 77
77 -
 78
78 -
 79
79 -
80
-
81
-
82
-
83
-
84
-
85
-
86
-
87
-
88
-
89
-
90
-
91
-
92
-
93
-
94
-
95
-
96
-
97
-
98
-
99
-
100
-
101
-
102
-
103
-
104
-
105
-
106
-
107
-
108
-
109
-
110
-
111
-
112
 |
 |

Tesco PLC Annual Report and
Financial Statements 2008 67
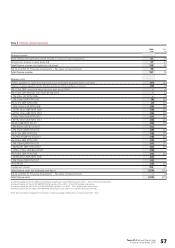
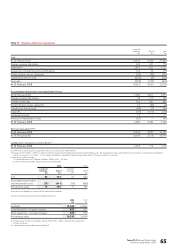
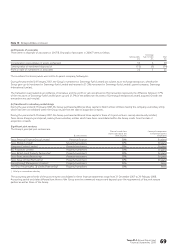
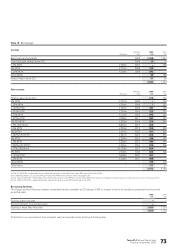
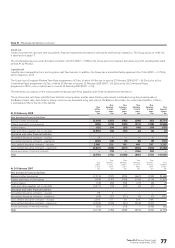
Note 11 Property, plant and equipment continued
The following amounts have been (charged)/credited to operating costs in the Group Income Statement during the current and prior year.
2008 2007
£m £m
Impairment losses
UK (48) (44)
Rest of Europe (25) (35)
Asia (4) (3)
(77) (82)
Reversal of impairment losses
UK 48 17
Rest of Europe 36 46
Asia 3 –
87 63
Net reversal of impairment losses/(impairment losses) 10 (19)
The impairment losses relate to stores whose recoverable amounts (either value in use or fair value less costs to sell) do not exceed the asset carrying
values. In all cases, impairment losses arose due to stores performing below forecasted trading levels.
The reversal of previous impairment losses arose principally due to improvements in stores’ performances over the last year which increased the net
present value of future cash flows.
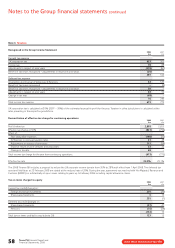
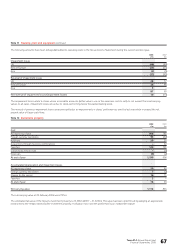
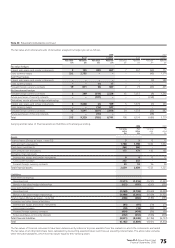
Note 12 Investment property
2008 2007
£m £m
Cost
At beginning of year 906 785
Foreign currency translation 93 (32)
Additions 50 26
Acquisitions through business combinations –32
Transfers 144 101
Classified as held for sale –(4)
Disposals (3) (2)
At end of year 1,190 906
Accumulated depreciation and impairment losses
At beginning of year 50 40
Foreign currency translation 7(2)
Charge for the period 16 11
Transfers 51
At end of year 78 50
Net carrying value 1,112 856
The net carrying value at 25 February 2006 was £745m.
The estimated fair value of the Group’s investment property is £2,265m (2007 – £1,522m). This value has been determined by applying an appropriate
rental yield to the rentals earned by the investment property. A valuation has not been performed by an independent valuer.