Tesco 2008 Annual Report Download - page 10
Download and view the complete annual report
Please find page 10 of the 2008 Tesco annual report below. You can navigate through the pages in the report by either clicking on the pages listed below, or by using the keyword search tool below to find specific information within the annual report.-
 1
1 -
 2
2 -
 3
3 -
 4
4 -
 5
5 -
 6
6 -
 7
7 -
 8
8 -
 9
9 -
 10
10 -
 11
11 -
 12
12 -
 13
13 -
 14
14 -
 15
15 -
 16
16 -
 17
17 -
 18
18 -
 19
19 -
 20
20 -
 21
21 -
22
-
23
-
24
-
25
-
26
-
27
-
28
-
29
-
30
-
31
-
32
-
33
-
34
-
35
-
36
-
37
-
38
-
39
-
40
-
41
-
42
-
43
-
44
-
45
-
46
-
47
-
48
-
49
-
50
-
51
-
52
-
53
-
54
-
55
-
56
-
57
-
58
-
59
-
60
-
61
-
62
-
63
-
64
-
65
-
66
-
67
-
68
-
69
-
70
-
71
-
72
-
73
-
74
-
75
-
76
-
77
-
78
-
79
-
80
-
81
-
82
-
83
-
84
-
85
-
86
-
87
-
88
-
89
-
90
-
91
-
92
-
93
-
94
-
95
-
96
-
97
-
98
-
99
-
100
-
101
-
102
-
103
-
104
-
105
-
106
-
107
-
108
-
109
-
110
-
111
-
112
 |
 |

Tesco PLC Annual Report and
Financial Statements 2008
8
2008* 2007
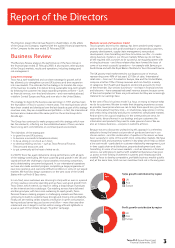
Sales growth
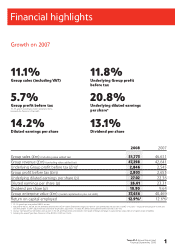
Change in Group sales over the year (including value added tax) 11.1% 10.9%
UK sales growth 6.7% 9.0%
International sales growth 25.3% 17.9%
International sales growth (at constant exchange rates) 22.5% 17.4%
Profit before tax £2,803 £2,653m
Underlying profit before tax £2,846 £2,545m
Trading margin
UK trading margin 5.9% 5.9%
International trading margin 5.6%§5.7%
Trading margin is calculated from the trading profit expressed as a percentage of Group revenue (sales excluding value
added tax).It is a measure of profit generation from sales and is a comparable performance measure with other companies.
This is how much we made from trade in our stores, taking account of the cost of the products sold, wages and salaries,
expenses associated with running the stores, depots and head office, and the cost of depreciation of the assets used to
generate the profits. Trading profit is stated after adjusting operating profit for the impact of IAS 19, IAS 32 and IAS 39
(principally pension costs and the marking to market of financial instruments). It also excludes the non-cash elements of
IAS 17 ‘Leases’, relating to the impact of annual uplifts in rents and rent-free periods.
Net cash inflow/(outflow) £801m £(265)m
Net cash inflow is the cash received less cash spent during the financial period, after financing activities.
Capital expenditure £3.9bn £3.0bn
This is the amount invested in purchasing fixed assets.
UK £2.5bn £1.9bn
International £1.4bn £1.1bn
Net borrowings and gearing
Net borrowings £6.2bn £4.9bn*
Gearing 52% 46%
Return on capital employed (ROCE) 12.9%‡12.6%†
ROCE is calculated as profit before interest less tax divided by the average of net assets plus net debt plus
dividend creditor less net assets held for sale. ROCE is a relative profit measurement that not only incorporates
the funds shareholders have invested, but also funds invested by banks and other lenders, and therefore shows
the productivity of the assets of the Group.
Underlying diluted earnings per share 27.02p 22.36p
Underlying diluted earnings per share is the calculation of profit after tax and minority interest divided by the
diluted weighted average number of shares in issue during the year. It is the amount which could be paid out on each
share if the Company decided to distribute all its profits as dividends instead of retaining some for future expansion.
* The measurement of net debt has been revised to include loans receivable from joint ventures. Going forward net debt will be stated inclusive of the loan receivables from joint ventures.
§ International margins rose by 15 basis points excluding the impact of consolidating the China business.
‡ Using a ‘normalised’ tax rate before start-up costs in the US and Tesco Direct, and excludes the impact of foreign exchange in equity and our acquisition of a majority share of Dobbies.
† Including the one-off gain from Pensions A-Day, ROCE was 13.6%.
www.tesco.com/annualreport08
Business Review continued