Tesco 2008 Annual Report Download - page 57
Download and view the complete annual report
Please find page 57 of the 2008 Tesco annual report below. You can navigate through the pages in the report by either clicking on the pages listed below, or by using the keyword search tool below to find specific information within the annual report.-
 1
1 -
2
-
3
-
4
-
5
-
6
-
7
-
8
-
9
-
10
-
11
-
12
-
13
-
14
-
15
-
16
-
17
-
18
-
19
-
20
-
21
-
22
-
23
-
24
-
25
-
26
-
27
-
28
-
29
-
30
-
31
-
32
-
33
-
34
-
35
-
36
-
37
-
38
-
39
-
40
-
41
-
42
-
43
-
44
-
45
-
46
-
 47
47 -
 48
48 -
 49
49 -
 50
50 -
 51
51 -
 52
52 -
 53
53 -
 54
54 -
 55
55 -
 56
56 -
 57
57 -
 58
58 -
 59
59 -
 60
60 -
 61
61 -
 62
62 -
 63
63 -
 64
64 -
 65
65 -
 66
66 -
 67
67 -
68
-
69
-
70
-
71
-
72
-
73
-
74
-
75
-
76
-
77
-
78
-
79
-
80
-
81
-
82
-
83
-
84
-
85
-
86
-
87
-
88
-
89
-
90
-
91
-
92
-
93
-
94
-
95
-
96
-
97
-
98
-
99
-
100
-
101
-
102
-
103
-
104
-
105
-
106
-
107
-
108
-
109
-
110
-
111
-
112
 |
 |

Tesco PLC Annual Report and
Financial Statements 2008 55
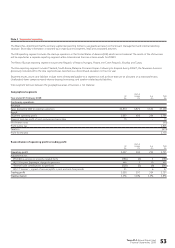
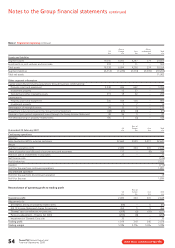
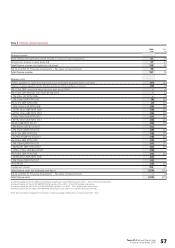
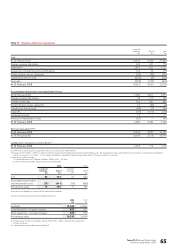
Note 2 Segmental reporting continued
Rest of Other/
UK Europe Asia unallocated Total
£m £m £m £m £m
Assets and liabilities
Segment assets 16,323 4,552 3,397 221 24,493
Investments in joint ventures and associates 307 2 5 – 314
Total assets 16,630 4,554 3,402 221 24,807
Segment liabilities (5,602) (903) (1,031) (6,700) (14,236)
Total net assets 10,571
Other segment information
Capital expenditure (including acquisitions through business combinations):
Property, plant and equipment 1,765 786 516 – 3,067
Investment property – 36 22 – 58
Goodwill and other intangible assets 197 52 420 – 669*
Depreciation:
Property, plant and equipment 520 155 99 – 774
Investment property – 7 4 – 11
Amortisation of intangible assets 79 8 6 – 93
Impairment losses recognised in the Group Income Statement (44) (35) (3) – (82)
Reversal of prior period impairment losses through the Group Income Statement 17 46 – – 63
Profit/(loss) arising on property-related items 98 – (6) – 92
* Includes £166m of goodwill transferred in from joint ventures, following the acquisition of additional shares in dunnhumby and Hymall.
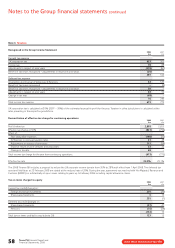
Business segments
The Group has one business segment, retail and associated activities.
2008 2007
£m £m
Revenue 47,298 42,641
Segment assets 29,859 24,493
Segment liabilities (18,262) (14,236)
Capital expenditure (including acquisitions through business combinations) 4,215 3,794
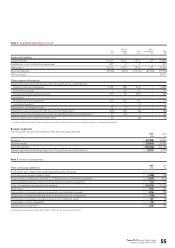
Note 3 Income and expenses
2008 2007
From continuing operations £m £m
Profit before tax is stated after charging/(crediting) the following:
Profit arising on property-related items (188) (92)
Rental income, of which £211m (2007 – £166m) relates to investment properties (267) (210)
Direct operating expenses arising on rental earning investment properties 54 47
Costs of inventories recognised as an expense 35,279 31,104
Stock losses 700 581
Depreciation of property, plant and equipment and investment property 876 785
Net (reversal of impairment)/impairment of property, plant and equipment (10) 19
Amortisation of internally-generated development intangible assets 87 69
Amortisation of other intangibles 29 24
Operating lease expenses(a) 520 394
(a) Operating lease expenses include £88m (2007 – £89m) for hire of plant and machinery.