Tesco 2008 Annual Report Download - page 3
Download and view the complete annual report
Please find page 3 of the 2008 Tesco annual report below. You can navigate through the pages in the report by either clicking on the pages listed below, or by using the keyword search tool below to find specific information within the annual report.-
 1
1 -
 2
2 -
 3
3 -
 4
4 -
 5
5 -
 6
6 -
 7
7 -
 8
8 -
 9
9 -
 10
10 -
 11
11 -
 12
12 -
 13
13 -
 14
14 -
15
-
16
-
17
-
18
-
19
-
20
-
21
-
22
-
23
-
24
-
25
-
26
-
27
-
28
-
29
-
30
-
31
-
32
-
33
-
34
-
35
-
36
-
37
-
38
-
39
-
40
-
41
-
42
-
43
-
44
-
45
-
46
-
47
-
48
-
49
-
50
-
51
-
52
-
53
-
54
-
55
-
56
-
57
-
58
-
59
-
60
-
61
-
62
-
63
-
64
-
65
-
66
-
67
-
68
-
69
-
70
-
71
-
72
-
73
-
74
-
75
-
76
-
77
-
78
-
79
-
80
-
81
-
82
-
83
-
84
-
85
-
86
-
87
-
88
-
89
-
90
-
91
-
92
-
93
-
94
-
95
-
96
-
97
-
98
-
99
-
100
-
101
-
102
-
103
-
104
-
105
-
106
-
107
-
108
-
109
-
110
-
111
-
112
 |
 |

Tesco PLC Annual Report and
Financial Statements 2008 1
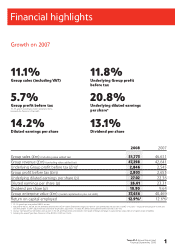
Financial highlights
Growth on 2007
11.1%
Group sales (including VAT)
5.7%
Group profit before tax
(15.3% growth excluding last year’s exceptional items;
principally the Pensions A-Day credit)
14.2%
Diluted earnings per share
11.8%
Underlying Group profit
before tax
20.8%
Underlying diluted earnings
per share*
13.1%
Dividend per share
2008 2007
Group sales (£m) (including value added tax) 51,773 46,611
Group revenue (£m) (excluding value added tax) 47,298 42,641
Underlying Group profit before tax (£m)†2,846 2,545
Group profit before tax (£m) 2,803 2,653
Underlying diluted earnings per share (p) 27.02 22.36
Diluted earnings per share (p) 26.61 23.31
Dividend per share (p) 10.90 9.64
Group enterprise value (£m) (market capitalisation plus net debt) 37,656 40,469
Return on capital employed 12.9%§12.6%‡
* 13.1% growth on a normalised 28.9% tax rate.
† Adjusted for IAS 32, IAS 39, the net difference between the IAS 19 Income Statement charge and ‘normal’ cash contributions for pensions and IAS 17 ‘Leases’ – impact of annual uplifts in rent and
rent-free periods. In 2007 adjustment was also made for pensions adjustment – Finance Act 2006 and impairment of the Gerrards Cross site.
§ Using a ‘normalised’ tax rate before start-up costs in the US and Tesco Direct, and excludes the impact of foreign exchange in equity and our acquisition of a majority share of Dobbies
‡ Including the one-off gain from Pensions A-Day, ROCE in 2007 was 13.6%.