Tesco 2008 Annual Report Download - page 56
Download and view the complete annual report
Please find page 56 of the 2008 Tesco annual report below. You can navigate through the pages in the report by either clicking on the pages listed below, or by using the keyword search tool below to find specific information within the annual report.-
 1
1 -
2
-
3
-
4
-
5
-
6
-
7
-
8
-
9
-
10
-
11
-
12
-
13
-
14
-
15
-
16
-
17
-
18
-
19
-
20
-
21
-
22
-
23
-
24
-
25
-
26
-
27
-
28
-
29
-
30
-
31
-
32
-
33
-
34
-
35
-
36
-
37
-
38
-
39
-
40
-
41
-
42
-
43
-
44
-
45
-
 46
46 -
 47
47 -
 48
48 -
 49
49 -
 50
50 -
 51
51 -
 52
52 -
 53
53 -
 54
54 -
 55
55 -
 56
56 -
 57
57 -
 58
58 -
 59
59 -
 60
60 -
 61
61 -
 62
62 -
 63
63 -
 64
64 -
 65
65 -
 66
66 -
67
-
68
-
69
-
70
-
71
-
72
-
73
-
74
-
75
-
76
-
77
-
78
-
79
-
80
-
81
-
82
-
83
-
84
-
85
-
86
-
87
-
88
-
89
-
90
-
91
-
92
-
93
-
94
-
95
-
96
-
97
-
98
-
99
-
100
-
101
-
102
-
103
-
104
-
105
-
106
-
107
-
108
-
109
-
110
-
111
-
112
 |
 |

www.tesco.com/annualreport08
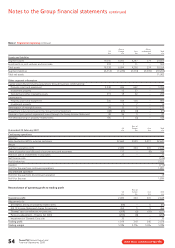
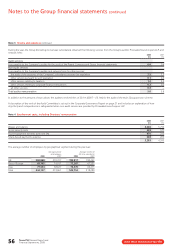
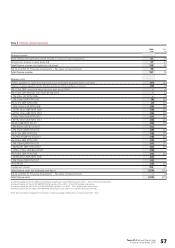
Note 2 Segmental reporting continued
Rest of Other/
UK Europe Asia unallocated Total
£m £m £m £m £m
Assets and liabilities
Segment assets 19,245 6,093 4,247 274 29,859
Investments in joint ventures and associates 293 1 11 – 305
Total assets 19,538 6,094 4,258 274 30,164
Segment liabilities (6,514) (1,229) (1,314) (9,205) (18,262)
Total net assets 11,902
Other segment information
Capital expenditure (including acquisitions through business combinations):
Property, plant and equipment 2,548 696 662 – 3,906
Investment property – 13 37 – 50
Goodwill and other intangible assets 219 18 22 – 259
Depreciation:
Property, plant and equipment 536 188 136 – 860
Investment property – 9 7 – 16
Amortisation of intangible assets 99 12 5 – 116
Impairment losses recognised in the Group Income Statement (48) (25) (4) – (77)
Reversal of prior period impairment losses through the Group Income Statement 48 36 3 – 87
Profit/(loss) arising on property-related items 186 5 (3) – 188
Rest of
UK Europe Asia Total
Year ended 24 February 2007 £m £m £m £m
Continuing operations
Revenue
Sales (excluding VAT) to external customers 32,665 5,559 4,417 42,641
Result
Segment operating profit 2,083 324 241 2,648
Share of post-tax profit/(losses) of joint ventures and associates 111 – (5) 106
Profit on sale of investments in associates 25 – – 25
Net finance costs (126)
Profit before tax 2,653
Taxation (772)
Profit for the year from continuing operations 1,881
Discontinued operation
Profit for the year from discontinued operation 18
Profit for the year 1,899
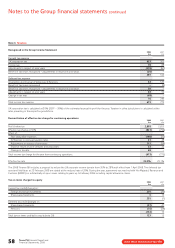
Reconciliation of operating profit to trading profit
Rest of
UK Europe Asia Total
£m £m £m £m
Operating profit 2,083 324 241 2,648
Adjustments for:
(Profit)/loss arising on property-related items (98) – 6 (92)
IAS 19 Income Statement charge for pensions 452 5 9 466
‘Normal’ cash contributions for pensions (308) (3) (10) (321)
Pensions adjustment – Finance Act 2006 (250) (8) – (258)
Impairment of Gerrards Cross site 35 – – 35
Trading profit 1,914 318 246 2,478
Trading margin 5.9% 5.7% 5.6% 5.8%
Tesco PLC Annual Report and
Financial Statements 2008
54
Notes to the Group financial statements continued