Suzuki 2011 Annual Report Download - page 54
Download and view the complete annual report
Please find page 54 of the 2011 Suzuki annual report below. You can navigate through the pages in the report by either clicking on the pages listed below, or by using the keyword search tool below to find specific information within the annual report.-
 1
1 -
2
-
3
-
4
-
5
-
6
-
7
-
8
-
9
-
10
-
11
-
12
-
13
-
14
-
15
-
16
-
17
-
18
-
19
-
20
-
21
-
22
-
23
-
24
-
25
-
26
-
27
-
28
-
29
-
30
-
31
-
32
-
33
-
34
-
35
-
36
-
37
-
38
-
39
-
40
-
41
-
42
-
43
-
 44
44 -
 45
45 -
 46
46 -
 47
47 -
 48
48 -
 49
49 -
 50
50 -
 51
51 -
 52
52 -
 53
53 -
 54
54 -
 55
55 -
 56
56 -
 57
57 -
 58
58 -
 59
59
 |
 |

SUZUKI MOTOR CORPORATION 53
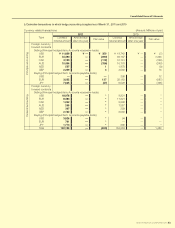
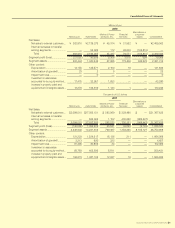
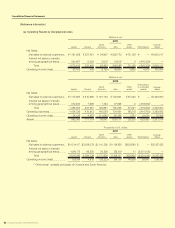
(b) Information about geographical areas (2011) and Overseas net sales (2010)
(Information about Geographic Areas)
Millions of yen
2011
Japan India Other Total
Net sales* ..................................... ¥937,452 ¥684,780 ¥985,984 ¥2,608,217
Thousands of U.S. dollars
2011
Japan India Other Total
Net sales* ..................................... $11,274,228 $8,235,488 $11,857,904 $31,367,622
* Net sales are counted based on the country location of external customers and divided by countries.
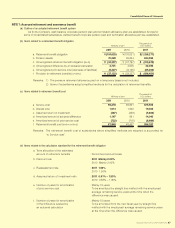
(Overseas net sales)
Millions of yen
2010
Europe North America Asia Other areas* Consolidated
Overseas sales ............................. ¥451,145 ¥131,824 ¥771,726 ¥161,808 ¥1,516,504
Consolidated net sales ...................................................................................................................................2,469,063
Ratio of overseas sales to
consolidated net sales ........... 18.3% 5.3% 31.3% 6.6% 61.4%
* “Other areas” consists principally of Oceania and South America.
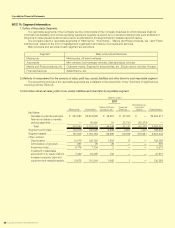
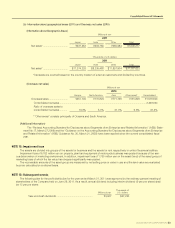
NOTE 15: Impairment loss
The assets are divided into groups of the assets for business and the assets for rent respectively in units of business facilities.
Impairment loss of 6,762 million yen on property, plant and equipment of motorcycle business was posted because of the seri-
ous deterioration of marketing environment. In addition, impairment loss of 1,750 million yen on the asset (land) of the asset group of
marketing base of which the fair value has dropped significantly was posted.
The recoverable amounts of the asset group are measured by net selling price or value in use and the land value are evaluated
by price calculated on a rational basis.
NOTE 16: Subsequent events
The following plan for the profit distribution for the year ended March 31, 2011 was approved by the ordinary general meeting of
shareholders of the Company held on June 29, 2011. As a result, annual dividend including interim dividend (6 yen per share) shall
be 13 yen per share:
Millions of yen
Thousands of
U.S. dollars
Year-end cash dividends ...................................................... ¥3,927 $47,230
Consolidated Financial Statements
(Additional Information)
The “Revised Accounting Standard for Disclosures about Segments of an Enterprise and Related Information” (ASBJ State-
ment No.17, March 27,2009) and the “Guidance on the Accounting Standard for Disclosures about Segments of an Enterprise
and Related Information” (ASBJ Guidance No. 20, March 21, 2008) have been applied since the current consolidated fiscal
year.