Suzuki 2011 Annual Report Download - page 24
Download and view the complete annual report
Please find page 24 of the 2011 Suzuki annual report below. You can navigate through the pages in the report by either clicking on the pages listed below, or by using the keyword search tool below to find specific information within the annual report.-
 1
1 -
2
-
3
-
4
-
5
-
6
-
7
-
8
-
9
-
10
-
11
-
12
-
13
-
 14
14 -
 15
15 -
 16
16 -
 17
17 -
 18
18 -
 19
19 -
 20
20 -
 21
21 -
 22
22 -
 23
23 -
 24
24 -
 25
25 -
 26
26 -
 27
27 -
 28
28 -
 29
29 -
 30
30 -
 31
31 -
 32
32 -
 33
33 -
 34
34 -
35
-
36
-
37
-
38
-
39
-
40
-
41
-
42
-
43
-
44
-
45
-
46
-
47
-
48
-
49
-
50
-
51
-
52
-
53
-
54
-
55
-
56
-
57
-
58
-
59
 |
 |

SUZUKI MOTOR CORPORATION 23
Financial Review
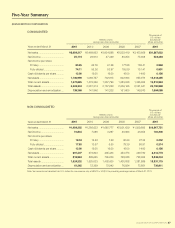
1. Operating results
The management environment of the Group for FY2010 continues to be in a severe situation such as the continuation of high
unemployment rates in Europe and the US, even though the global economy has gradually recovered because of the economic
recoveries centering on Asia and economic stimulus measures by each government. The domestic economy had been picking up
because of the expansion of the overseas economies, however we are now in the worrying situation of stagnation of economic activi-
ties by the Great East Japan Earthquake.
Under these circumstances, consolidated net sales of FY2010 increased by ¥139.1 billion (5.6%) to ¥2,608.2 billion year-on-year
because of the increased sales of motorcycles and automobiles in Asia though the sales in Europe and North America were lower
than the previous fiscal year. As for the consolidated income, the increased income by the sales increase and the cost reduction
covered the reduced income by the exchange influences. As a result, operating income increased by ¥27.5 billion (34.7%) to ¥106.9
billion and net income increased by ¥16.3 billion (56.2%) to ¥45.2 billion year-on-year.
(1) The operating results by segment
(a) Motorcycle
Sales of the motorcycle business decreased by ¥5.2 billion (2.0%) to ¥257.7 billion year-on-year due to the sales decline in
Europe, North America and Japan despite the sales increase in Asia. As for income and loss, operating loss was ¥10.8 billion
on account of the continued sales slowdown of large-size motorcycles to Europe and the US, but operating loss was reduced
by ¥10.3 billion year-on-year because of improvement of operating results in Asia.
(b) Automobile
Domestic market has been slow in and after October on account of the termination of the government subsidies for eco-
friendly car purchases. Furthermore, on account of the impact of the Great East Japan Earthquake, domestic sales were
below the previous fiscal year despite our sales expansion efforts such as the launch of the new “SWIFT”, “SOLIO” and “MR
WAGON” and strengthening of sales force. Overseas sales exceeded the previous fiscal year because of the sales increase
in emerging countries centering on Asia such as India and Indonesia. As a result, sales of the automobile business increased
by ¥139.0 billion (6.4%) to ¥2,323.0 billion year-on-year. Operating income also increased by ¥17.9 billion (19.8%) to ¥108.5
billion year-on-year.
(c) Marine and Power products, etc
Sales of marine and power products, etc. business increased by ¥3.2 billion (7.1%) to ¥48.6 billion year-on-year because
of the sales increase mainly in Europe, North America, Asia and Oceania. Operating income also increased by ¥1.4 billion
(26.2%) to ¥6.7 billion year-on-year.
(d) Financial Services
Sales of financial services business decreased by ¥18.5 billion (23.2%) to ¥61.1 billion year-on-year and operating income
decreased by ¥0.8 billion (21.3%) to ¥3.0 billion year-on-year.
(2) The operating results by geographical areas
(a) Japan
Sales increased by ¥83.9 billion (5.6%) to ¥1,572.4 billion year-on-year because of the increase in exports of automobiles
to Europe, Asia and Central and South America despite the impact of the Great East Japan Earthquake. Operating income
increased by ¥19.1 billion (55.8%) to ¥53.2 billion year-on-year because of the increased income by the sales increase and
the cost reduction covered the reduced income by the influence of exchange rates.
(b) Europe
Sales decreased by ¥90.5 billion (21.4%) to ¥333.0 billion year-on-year on account of the influences by the termination of
the car scrapping scheme of each government. Operating income also decreased by ¥4.2 billion (91.1%) to ¥0.4 billion year-
on-year.
(c) North America
On account of the reduced sales of motorcycles and automobiles, sales decreased by ¥31.5 billion (24.4%) to ¥97.4 bil-
lion year-on-year. As for income and loss, operating loss was reduced by ¥9.4 billion to ¥2.2 billion year-on-year because of
the reduction of various expenses.
(d) Asia
Sales increased by ¥168.0 billion (21.5%) to ¥948.6 billion year-on-year because of the increased sales of motorcycles
and automobiles in various countries such as India, Indonesia, Pakistan and Thailand. Operating income decreased by ¥9.3
billion (16.5%) to ¥46.9 billion year-on-year.
(e) Other areas
Sales increased by ¥7.8 billion (11.4%) to ¥75.2 billion year-on-year because of the increased sales of automobiles in
Oceania and Africa. Operating income also increased by ¥2.5 billion (200.0%) to ¥3.7 billion year-on-year.