Suzuki 2011 Annual Report Download - page 39
Download and view the complete annual report
Please find page 39 of the 2011 Suzuki annual report below. You can navigate through the pages in the report by either clicking on the pages listed below, or by using the keyword search tool below to find specific information within the annual report.-
 1
1 -
2
-
3
-
4
-
5
-
6
-
7
-
8
-
9
-
10
-
11
-
12
-
13
-
14
-
15
-
16
-
17
-
18
-
19
-
20
-
21
-
22
-
23
-
24
-
25
-
26
-
27
-
28
-
 29
29 -
 30
30 -
 31
31 -
 32
32 -
 33
33 -
 34
34 -
 35
35 -
 36
36 -
 37
37 -
 38
38 -
 39
39 -
 40
40 -
 41
41 -
 42
42 -
 43
43 -
 44
44 -
 45
45 -
 46
46 -
 47
47 -
 48
48 -
 49
49 -
50
-
51
-
52
-
53
-
54
-
55
-
56
-
57
-
58
-
59
 |
 |

38 SUZUKI MOTOR CORPORATION
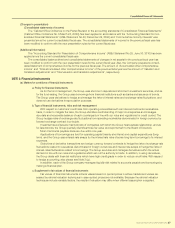
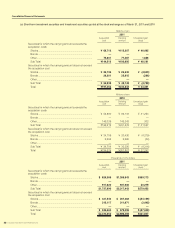
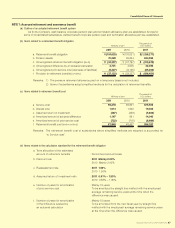
(b) Matters for fair values of the financial instruments
Carrying amounts in the consolidated balance sheet, fair values and unrealized gain (loss) at March 31, 2011 and 2010
are as follows. Financial instruments whose fair value cannot be reliably determined are not included in the below table.
(Amount: Millions of yen)
2011 2010
Carrying
amount Fair value Unrealized
gain (loss)
Carrying
amount Fair value Unrealized
gain (loss)
Cash and deposits ¥261,264 ¥261,264 ¥ — ¥147,394 ¥147,394 ¥ —
Notes and accounts receivables-trade 204,603 204,181 (421)248,565 248,565 —
Short-term investment securities and
Investment securities
Available-for-sale securities
Investments in subsidiaries and affiliates
240,843
5,575
240,843
8,262
—
2,687
261,867
5,937
261,867
6,618
—
680
Total of assets 712,286 714,552 2,265 663,764 664,444 680
Accounts payable-trade 267,209 267,209 —391,874 391,874 —
Short-term loans payable 178,559 178,559 —221,320 221,320 —
Current portion of long-term loans payable
59,714 59,935 (220)39,616 39,629 (13)
Accrued expenses
139,129 139,129 ————
Bonds with subscription rights to shares
149,975 150,274 (299)149,975 153,724 (3,749)
Long-term loans payable 96,333 97,070 (737)136,104 136,559 (455)
Total of liabilities 890,921 892,179 (1,257)938,891 943,109 (4,218)
Derivatives
Hedge accounting is applied
Hedge accounting is not applied
(900
(327
)
)
(900
(327
)
)
—
—
1,504
(373)
1,504
(373)
—
—
(Amount: Thousands of U.S. dollars)
2011
Carrying
amount Fair value Unrealized
gain (loss)
Cash and deposits $3,142,083 $3,142,083 $ —
Notes and accounts receivables-trade 2,460,653 2,455,579 (5,073)
Short-term investment securities and
Investment securities
Available-for-sale securities
Investments in subsidiaries and affiliates
2,896,498
67,049
2,896,498
99,373
—
32,324
Total of assets 8,566,285 8,593,535 27,250
Accounts payable-trade 3,213,584 3,213,584 —
Short-term loans payable 2,147,443 2,147,443 —
Current portion of long-term loans payable
718,158 720,806 (2,648)
Accrued expenses
1,673,231 1,673,231 —
Bonds with subscription rights to shares
1,803,668 1,807,275 (3,607)
Long-term loans payable 1,158,546 1,167,417 (8,870)
Total of liabilities 10,714,632 10,729,758 (15,126)
Derivatives*
Hedge accounting is applied
Hedge accounting is not applied
(10,831
(3,936
)
)
(10,831
(3,936
)
)
—
—
* Assets or liabilities derived from derivatives are shown on a net basis and net liabilities are shown as ( ).
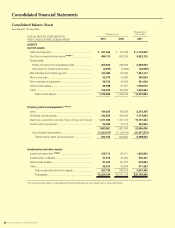
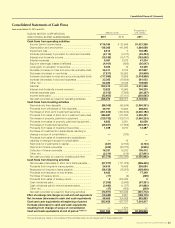
Consolidated Financial Statements