Suzuki 2011 Annual Report Download - page 29
Download and view the complete annual report
Please find page 29 of the 2011 Suzuki annual report below. You can navigate through the pages in the report by either clicking on the pages listed below, or by using the keyword search tool below to find specific information within the annual report.-
 1
1 -
2
-
3
-
4
-
5
-
6
-
7
-
8
-
9
-
10
-
11
-
12
-
13
-
14
-
15
-
16
-
17
-
18
-
 19
19 -
 20
20 -
 21
21 -
 22
22 -
 23
23 -
 24
24 -
 25
25 -
 26
26 -
 27
27 -
 28
28 -
 29
29 -
 30
30 -
 31
31 -
 32
32 -
 33
33 -
 34
34 -
 35
35 -
 36
36 -
 37
37 -
 38
38 -
 39
39 -
40
-
41
-
42
-
43
-
44
-
45
-
46
-
47
-
48
-
49
-
50
-
51
-
52
-
53
-
54
-
55
-
56
-
57
-
58
-
59
 |
 |

28 SUZUKI MOTOR CORPORATION
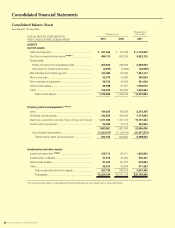
Consolidated Balance Sheets
As of March 31, 2011 and 2010
Consolidated Financial Statements
SUZUKI MOTOR CORPORATION
AND CONSOLIDATED SUBSIDIARIES
Millions of yen
Thousands of
U.S. dollars
2011 2010 2011
ASSETS
Current assets:
Cash and deposits ............................................................ ¥ 261,264 ¥ 147,394 $ 3,142,083
Short-term investment securities *NOTE 4 ........................... 484,110 602,388 5,822,133
Receivables:
Notes and accounts receivables-trade ......................... 204,603 248,565 2,460,653
Allowance for doubtful accounts ................................... (2,997)(3,066)(36,045)
Merchandise and finished goods ..................................... 163,083 172,322 1,961,312
Work in process ................................................................. 22,078 19,380 265,524
Raw materials and supplies .............................................. 46,725 44,492 561,939
Deferred tax assets ............................................................ 86,398 97,657 1,039,070
Other ................................................................................... 108,329 150,202 1,302,823
Total current assets ..................................................... 1,372,885 1,479,336 16,510,954
Property, plant and equipment: *NOTE 5
Land ................................................................................... 184,205 180,538 2,215,345
Buildings and structures .................................................... 342,552 345,543 4,119,694
Machinery, equipment, vehicles, tools, furniture and fixtures
1,311,062 1,321,010 15,767,443
Construction in progress ................................................... 46,060 34,174 553,942
1,883,881 1,881,268 22,656,426
Accumulated depreciation ............................................ (1,360,157 )(1,315,414 )(16,357,873)
Total property, plant and equipment .......................... 523,724 565,853 6,298,552
Investments and other assets:
Investment securities *NOTE 4 ............................................. 165,713 135,271 1,992,942
Investments in affiliates ...................................................... 41,610 43,280 500,431
Deferred tax assets ............................................................ 81,222 101,277 976,824
Other ................................................................................... 39,187 56,294 471,283
Total investments and other assets............................ 327,734 336,123 3,941,482
Total assets ................................................................. ¥2,224,344 ¥2,381,314 $26,750,988
The accompanying Notes to Consolidated Financial Statements are an integral part of these statements.