Suzuki 2011 Annual Report Download - page 34
Download and view the complete annual report
Please find page 34 of the 2011 Suzuki annual report below. You can navigate through the pages in the report by either clicking on the pages listed below, or by using the keyword search tool below to find specific information within the annual report.-
 1
1 -
2
-
3
-
4
-
5
-
6
-
7
-
8
-
9
-
10
-
11
-
12
-
13
-
14
-
15
-
16
-
17
-
18
-
19
-
20
-
21
-
22
-
23
-
 24
24 -
 25
25 -
 26
26 -
 27
27 -
 28
28 -
 29
29 -
 30
30 -
 31
31 -
 32
32 -
 33
33 -
 34
34 -
 35
35 -
 36
36 -
 37
37 -
 38
38 -
 39
39 -
 40
40 -
 41
41 -
 42
42 -
 43
43 -
 44
44 -
45
-
46
-
47
-
48
-
49
-
50
-
51
-
52
-
53
-
54
-
55
-
56
-
57
-
58
-
59
 |
 |

SUZUKI MOTOR CORPORATION 33
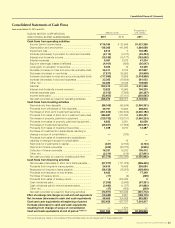
Consolidated Statements of Cash Flows
Years ended March 31, 2011 and 2010
SUZUKI MOTOR CORPORATION
AND CONSOLIDATED SUBSIDIARIES
Millions of yen
Thousands of
U.S. dollars
2011 2010 2011
Cash flows from operating activities
Income before income taxes ............................................. ¥118,186 ¥ 92,499 $1,421,368
Depreciation and amortization .......................................... 138,368 141,846 1,664,088
Impairment loss ................................................................. 8,513 0102,386
Increase (decrease) in provision for retirement benefits .. (2,114)(3,107)(25,424)
Interest and dividends income .......................................... (15,190)(16,177)(182,690)
Interest expenses .............................................................. 5,091 8,276 61,234
Equity in (earnings) losses of affiliates .............................. (4,161)(692)(50,047)
Loss (gain) on valuation of securities ............................... 5,356 19 64,425
Decrease (increase) in notes and accounts receivable-trade
36,411 8,103 437,897
Decrease (increase) in inventories ................................... (7,811)95,993 (93,946)
Increase (decrease) in notes and accounts payable-trade
(117,986)16,859 (1,418,956)
Increase (decrease) in accrued expenses ...................... 23,365 (19,509)281,002
Other, net ............................................................................ 62,280 10,348 749,008
Subtotal 250,310 334,460 3,010,346
Interest and dividends income received .......................... 13,822 16,966 166,239
Interest expenses paid ...................................................... (5,012)(7,888)(60,287)
Income taxes paid ............................................................. (32,650)(17,161)(392,665)
Net cash provided by (used in) operating activities 226,470 326,377 2,723,633
Cash flows from investing activities
Payments into time deposits ............................................. (88,169)(45,844)(1,060,361)
Proceeds from withdrawal of time deposits...................... 49,791 74,606 598,816
Purchases of short-term investment securities ................ (301,849)(464,632)(3,630,182)
Proceeds from sales of short-term investment securities
386,687 313,030 4,650,483
Purchases of property, plant and equipment ................... (129,732)(129,131)(1,560,224)
Proceeds from sales of property, plant and equipment ... 6,823 6,361 82,058
Purchases of investment securities .................................. (25,227)(17,508)(303,391)
Proceeds from sales of investment securities .................. 1,038 9,210 12,487
Purchase of investments in subsidiaries resulting in
change in scope of consolidation ..................................... —(376)—
Proceeds from sales of investments in subsidiaries
resulting in change in scope of consolidation .................. —15 —
Payments for investments in capital ................................. (431)(2,163)(5,194)
Payments of loans receivable ........................................... (326)(40,770)(3,925)
Collection of loans receivable ........................................... 16,331 15,533 196,412
Other, net ............................................................................ (2,314)(616)(27,841)
Net cash provided by (used in) investing activities (87,379)(282,286)(1,050,862)
Cash flows from financing activities
Net increase (decrease) in short-term loans payable ...... (57,077)(171,079)(686,445)
Proceeds from long-term loans payable .......................... 24,616 78,489 296,054
Repayment of long-term loans payable ........................... (38,158)(18,976)(458,906)
Proceeds from issuance of new shares ............................ 6,423 —77,249
Purchase of treasury stock ................................................ (17)(4)(208)
Proceeds from sales of treasury stock .............................. 0222,485 5
Cash dividends paid ......................................................... (7,266)(5,645)(87,391)
Cash dividends paid to minority shareholders ................. (3,480)(1,337)(41,860)
Other, net ............................................................................ (17)(485)(209)
Net cash provided by (used in) financing activities (74,977)103,445 (901,712)
Effect of exchange rate changes on cash and cash equivalents
(15,646)6,551 (188,175)
Net increase (decrease) in cash and cash equivalents 48,466 154,088 582,883
Cash and cash equivalents at beginning of period 583,456 427,797 7,016,917
Increase (decrease) in cash and cash equivalents
resulting from change of scope of consolidation —1,570 —
Cash and cash equivalents at end of period *NOTE 10 ¥631,923 ¥583,456 $7,599,800
The accompanying Notes to Consolidated Financial Statements are an integral part of these statements.
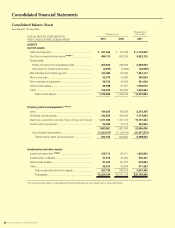
Consolidated Financial Statements