Suzuki 2011 Annual Report Download - page 53
Download and view the complete annual report
Please find page 53 of the 2011 Suzuki annual report below. You can navigate through the pages in the report by either clicking on the pages listed below, or by using the keyword search tool below to find specific information within the annual report.-
 1
1 -
2
-
3
-
4
-
5
-
6
-
7
-
8
-
9
-
10
-
11
-
12
-
13
-
14
-
15
-
16
-
17
-
18
-
19
-
20
-
21
-
22
-
23
-
24
-
25
-
26
-
27
-
28
-
29
-
30
-
31
-
32
-
33
-
34
-
35
-
36
-
37
-
38
-
39
-
40
-
41
-
42
-
 43
43 -
 44
44 -
 45
45 -
 46
46 -
 47
47 -
 48
48 -
 49
49 -
 50
50 -
 51
51 -
 52
52 -
 53
53 -
 54
54 -
 55
55 -
 56
56 -
 57
57 -
 58
58 -
 59
59
 |
 |

52 SUZUKI MOTOR CORPORATION
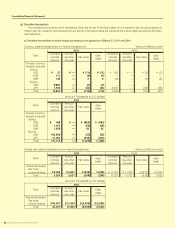
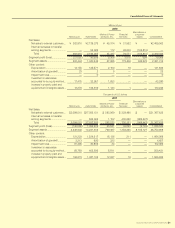
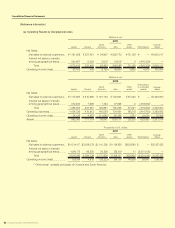
(Reference information)
(a) Operating Results by Geographical areas
Consolidated Financial Statements
Millions of yen
2011
Japan Europe
North
America Asia
Other
areas* Eliminations
Consoli-
dated
Net Sales:
Net sales to external customers ...
¥1,181,928
¥ 327,451 ¥ 94,907 ¥ 928,772 ¥ 75,158 ¥ —
¥2,608,217
Internal net sales or transfer
among geographical areas ..........
390,487
5,508 2,516 19,816 0(418,329)
—
Total
1,572,416
332,960 97,423 948,588 75,159 (418,329)
2,608,217
Operating income (loss) ...................
53,163 408 (2,180
)
46,904 3,663 4,975 106,934
Millions of yen
2010
Japan Europe
North
America Asia
Other
areas*
Eliminations
or corporate
assets
Consoli-
dated
Net Sales:
Net sales to external customers ...
¥1,115,963
¥ 415,890 ¥ 127,136 ¥ 742,631 ¥ 67,440 ¥ —
¥2,469,063
Internal net sales or transfer
among geographical areas ..........
372,500
7,590 1,744 37,996 0(419,832)
—
Total
1,488,463
423,481 128,881 780,628 67,441 (419,832)
2,469,063
Operating expenses .........................
1,454,336
418,913 140,524 724,461 66,219 (414,760)
2,389,695
Operating income (loss) ...................
34,126
4,567 (11,642)56,166 1,221 (5,071)
79,368
Assets ...............................................
995,360
177,714 36,047 503,777 29,320 639,093
2,381,314
Thousands of U.S. dollars
2011
Japan Europe
North
America Asia
Other
areas* Eliminations
Consoli-
dated
Net sales:
Net sales to external customers ...
$14,214,417
$3,938,079 $1,141,395
$11,169,838
$903,890
$
—
$31,367,622
Internal net sales or transfer
among geographical areas ..........
4,696,178
66,250 30,258
238,319
11
(5,031,018
)
—
Total
18,910,595
4,004,329 1,171,654
11,408,157
903,902
(5,031,018
)
31,367,622
Operating income (loss) ...................
639,364
4,910 (26,223
)
564,100
44,056
59,841
1,286,048
* “Other areas” consists principally of Oceania and South America.