Suzuki 2011 Annual Report Download - page 30
Download and view the complete annual report
Please find page 30 of the 2011 Suzuki annual report below. You can navigate through the pages in the report by either clicking on the pages listed below, or by using the keyword search tool below to find specific information within the annual report.-
 1
1 -
2
-
3
-
4
-
5
-
6
-
7
-
8
-
9
-
10
-
11
-
12
-
13
-
14
-
15
-
16
-
17
-
18
-
19
-
 20
20 -
 21
21 -
 22
22 -
 23
23 -
 24
24 -
 25
25 -
 26
26 -
 27
27 -
 28
28 -
 29
29 -
 30
30 -
 31
31 -
 32
32 -
 33
33 -
 34
34 -
 35
35 -
 36
36 -
 37
37 -
 38
38 -
 39
39 -
 40
40 -
41
-
42
-
43
-
44
-
45
-
46
-
47
-
48
-
49
-
50
-
51
-
52
-
53
-
54
-
55
-
56
-
57
-
58
-
59
 |
 |

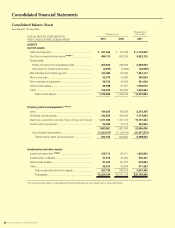
SUZUKI MOTOR CORPORATION 29
Millions of yen
Thousands of
U.S. dollars
2011 2010 2011
LIABILITIES AND NET ASSETS
Current liabilities:
Accounts payable-trade .................................................... ¥ 267,209 ¥ 391,874 $ 3,213,584
Short-term loans payable *NOTE 5 ...................................... 178,559 221,320 2,147,443
Current portion of long term loans payable *NOTE 5 .......... 59,714 39,616 718,158
Income taxes payable ....................................................... 11,064 13,129 133,067
Accrued expenses ............................................................ 139,129 121,136 1,673,231
Other ................................................................................... 150,045 146,837 1,804,510
Total current liabilities ................................................. 805,723 933,915 9,689,995
Noncurrent liabilities:
Bonds with subscription rights to shares *NOTE 5 .............. 149,975 149,975 1,803,668
Long-term loans payable *NOTE 5 ....................................... 96,333 136,104 1,158,546
Provision for retirement benefits *NOTE 7 ............................ 37,122 39,337 446,451
Provision for directors’ retirement benefits ........................ 1,440 1,453 17,327
Other ................................................................................... 26,750 30,771 321,714
Total noncurrent liabilities ........................................... 311,621 357,641 3,747,708
Total liabilities .............................................................. 1,117,345 1,291,556 13,437,703
Net assets:
Shareholders’ equity: *NOTE 12
Capital stock:
Common stock
Authorized - 1,500,000,000 shares
Issued,
as of March 31, 2011 – 561,047,304 ......................... 138,014 —1,659,828
as of March 31, 2010 – 557,387,304 ......................... —134,803 —
Capital surplus ................................................................... 144,364 141,153 1,736,196
Retained earnings ............................................................. 788,263 750,357 9,480,020
Treasury stock .................................................................... (78)(61)(946)
Total shareholders’ equity .......................................... 1,070,564 1,026,251 12,875,099
Accumulated other comprehensive income:
Valuation difference on available-for-sale securities ..... 25,717 16,546 309,292
Deferred gains or losses on hedges ............................. (614)910 (7,394)
Foreign currency translation adjustment ....................... (126,089)(91,725)(1,516,413)
Total accumulated other comprehensive income ..... (100,986)(74,268)(1,214,515)
Minority interests ................................................................ 137,422 137,774 1,652,700
Total net assets ¥1,106,999 ¥1,089,757 $13,313,285
Total liabilities and net assets ..................................... ¥2,224,344 ¥2,381,314 $26,750,988
Consolidated Financial Statements