Suzuki 2011 Annual Report Download - page 52
Download and view the complete annual report
Please find page 52 of the 2011 Suzuki annual report below. You can navigate through the pages in the report by either clicking on the pages listed below, or by using the keyword search tool below to find specific information within the annual report.-
 1
1 -
2
-
3
-
4
-
5
-
6
-
7
-
8
-
9
-
10
-
11
-
12
-
13
-
14
-
15
-
16
-
17
-
18
-
19
-
20
-
21
-
22
-
23
-
24
-
25
-
26
-
27
-
28
-
29
-
30
-
31
-
32
-
33
-
34
-
35
-
36
-
37
-
38
-
39
-
40
-
41
-
 42
42 -
 43
43 -
 44
44 -
 45
45 -
 46
46 -
 47
47 -
 48
48 -
 49
49 -
 50
50 -
 51
51 -
 52
52 -
 53
53 -
 54
54 -
 55
55 -
 56
56 -
 57
57 -
 58
58 -
 59
59
 |
 |

SUZUKI MOTOR CORPORATION 51
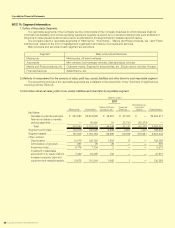
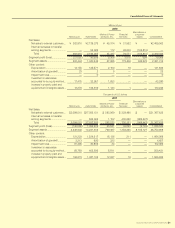
Millions of yen
2010
Motorcycle Automobile
Marine & Power
products, etc.
Financial
Services
Eliminations or
corporate
assets Consolidated
Net Sales:
Net sales to external customers
... ¥ 262,910 ¥2,129,276 ¥ 45,314 ¥ 31,562 ¥ — ¥2,469,063
Internal net sales or transfer
among segments ...................... —54,689 112 48,009 (102,810) —
Total 262,910 2,183,965 45,427 79,571 (102,810)2,469,063
Segment profit (loss) ..................... (21,057)90,608 5,306 3,815 694 79,368
Segment assets ............................ 202,444 1,320,542 47,995 173,408 636,923 2,381,314
Other content:
Depreciation .............................. 14,155 125,571 2,100 18 —141,846
Amortization of goodwill ............ 23 2 0 — — 25
Impairment loss ......................... — 0 — — — 0
Investment in associates
accounted for by equity method...
17,475 23,951 1,853 — — 43,280
Increase in property, plant and
equipment and intangible assets ...
12,279 106,819 1,143 1 — 120,244
Thousands of U.S. dollars
2011
Motorcycle Automobile
Marine & Power
products, etc.
Financial
Services
Eliminations or
corporate
assets Consolidated
Net Sales:
Net sales to external customers
... $3,099,010 $27,355,151 $ 583,969 $ 329,490 $ — $31,367,622
Internal net sales or transfer
among segments ...................... —582,684 1,102 405,660 (989,447) —
Total 3,099,010 27,937,835 585,072 735,151 (989,447)31,367,622
Segment profit (loss) ..................... (130,060)1,305,222 80,531 36,093 (5,743)1,286,042
Segment assets ............................ 2,248,949 14,241,304 799,387 1,356,220 8,105,127 26,750,988
Other content:
Depreciation .............................. 121,223 1,524,517 18,136 211 — 1,664,088
Amortization of goodwill ............ 3,213 920 323 — — 4,457
Impairment loss ......................... 81,495 20,856 34 — — 102,386
Investment in associates
accounted for by equity method...
88,783 402,836 8,811 — — 500,431
Increase in property, plant and
equipment and intangible assets ...
166,874 1,387,184 12,847 16 —1,566,923
Consolidated Financial Statements