Suzuki 2011 Annual Report Download - page 28
Download and view the complete annual report
Please find page 28 of the 2011 Suzuki annual report below. You can navigate through the pages in the report by either clicking on the pages listed below, or by using the keyword search tool below to find specific information within the annual report.-
 1
1 -
2
-
3
-
4
-
5
-
6
-
7
-
8
-
9
-
10
-
11
-
12
-
13
-
14
-
15
-
16
-
17
-
 18
18 -
 19
19 -
 20
20 -
 21
21 -
 22
22 -
 23
23 -
 24
24 -
 25
25 -
 26
26 -
 27
27 -
 28
28 -
 29
29 -
 30
30 -
 31
31 -
 32
32 -
 33
33 -
 34
34 -
 35
35 -
 36
36 -
 37
37 -
 38
38 -
39
-
40
-
41
-
42
-
43
-
44
-
45
-
46
-
47
-
48
-
49
-
50
-
51
-
52
-
53
-
54
-
55
-
56
-
57
-
58
-
59
 |
 |

SUZUKI MOTOR CORPORATION 27
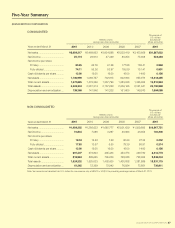
SUZUKI MOTOR CORPORATION
CONSOLIDATED
Millions of yen
(except per share amounts)
Thousands of
U.S. dollars
(except per
share amounts)
Years ended March 31 2011 2010 2009 2008 2007 2011
Net sales ...................................... ¥2,608,217 ¥2,469,063 ¥3,004,888 ¥3,502,419 ¥3,163,669 $31,367,622
Net income................................... 45,174 28,913 27,429 80,254 75,008 543,283
Net income per share:
Primary ..................................... 80.65 62.76 61.68 177.96 169.41 0.969
Fully diluted .............................. 74.11 55.26 53.97 155.89 151.41 0.891
Cash dividends per share ........... 13.00 12.00 16.00 16.00 14.00 0.156
Net assets .................................... 1,106,999 1,089,757 742,915 902,894 855,973 13,313,285
Total current assets ...................... 1,372,885 1,479,336 1,267,790 1,483,038 1,435,405 16,510,954
Total assets .................................. 2,224,344 2,381,314 2,157,849 2,409,165 2,321,441 26,750,988
Depreciation and amortization .... 138,368 141,846 141,203 161,600 149,910 1,664,088
NON-CONSOLIDATED
Millions of yen
(except per share amounts)
Thousands of
U.S. dollars
(except per
share amounts)
Years ended March 31 2011 2010 2009 2008 2007 2011
Net sales ...................................... ¥1,409,205 ¥1,286,633 ¥1,685,777 ¥2,031,639 ¥1,939,806 $16,947,751
Net income................................... 10,834 7,086 3,287 40,864 43,054 130,300
Net income per share:
Primary ..................................... 19.34 15.38 7.39 90.60 97.23 0.232
Fully diluted .............................. 17.80 13.57 6.50 79.39 86.91 0.214
Cash dividends per share ........... 13.00 12.00 16.00 16.00 14.00 0.156
Net assets .................................... 691,207 673,803 405,434 453,374 429,730 8,312,773
Total current assets ...................... 818,964 899,655 705,203 758,848 758,005 9,849,244
Total assets .................................. 1,524,232 1,625,023 1,402,420 1,430,088 1,381,889 18,331,115
Depreciation and amortization .... 61,265 72,359 72,942 76,584 73,881 736,811
Note: Yen amounts are translated into U.S. dollars for convenience only, at ¥83.15 = U.S.$1, the prevailing exchange rate as of March 31, 2011.
Five-Year Summary