Suzuki 2011 Annual Report Download - page 41
Download and view the complete annual report
Please find page 41 of the 2011 Suzuki annual report below. You can navigate through the pages in the report by either clicking on the pages listed below, or by using the keyword search tool below to find specific information within the annual report.-
 1
1 -
2
-
3
-
4
-
5
-
6
-
7
-
8
-
9
-
10
-
11
-
12
-
13
-
14
-
15
-
16
-
17
-
18
-
19
-
20
-
21
-
22
-
23
-
24
-
25
-
26
-
27
-
28
-
29
-
30
-
 31
31 -
 32
32 -
 33
33 -
 34
34 -
 35
35 -
 36
36 -
 37
37 -
 38
38 -
 39
39 -
 40
40 -
 41
41 -
 42
42 -
 43
43 -
 44
44 -
 45
45 -
 46
46 -
 47
47 -
 48
48 -
 49
49 -
 50
50 -
 51
51 -
52
-
53
-
54
-
55
-
56
-
57
-
58
-
59
 |
 |

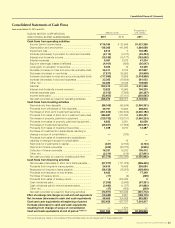
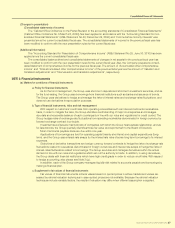
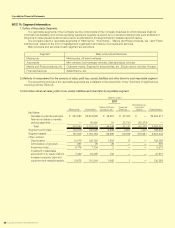
40 SUZUKI MOTOR CORPORATION
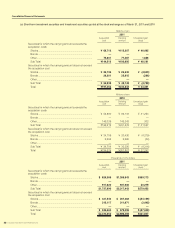
(c) Short-term investment securities and Investment securities quoted at the stock exchange as of March 31, 2011 and 2010
Consolidated Financial Statements
Millions of yen
2011
Acquisition
cost
Carrying
amount
Unrealized gain
(loss)
Securities for which the carrying amount exceeds the
acquisition costs
Stocks ................................................................................. ¥ 68,712 ¥115,207 ¥ 46,495
Bonds ................................................................................. — — —
Other ................................................................................... 75,801 77,487 1,686
Sub Total ¥144,513 ¥192,695 ¥ 48,181
Securities for which the carrying amount does not exceed
the acquisition cost
Stocks ................................................................................. ¥ 26,736 ¥ 22,232 ¥ (4,503)
Bonds ................................................................................. 26,201 25,915 (286)
Other ................................................................................... — — —
Sub Total ¥ 52,938 ¥ 48,148 ¥ (4,789)
Total ¥197,452 ¥240,843 ¥ 43,391
Millions of yen
2010
Acquisition
cost
Carrying
amount
Unrealized gain
(loss)
Securities for which the carrying amount exceeds the
acquisition costs
Stocks ................................................................................. ¥ 54,880 ¥ 86,133 ¥ 31,253
Bonds ................................................................................. — — —
Other ................................................................................... 145,039 145,343 303
Sub Total ¥199,919 ¥231,476 ¥ 31,557
Securities for which the carrying amount does not exceed
the acquisition cost
Stocks ................................................................................. ¥ 24,709 ¥ 20,430 ¥ (4,279)
Bonds ................................................................................. 9,995 9,960 (34)
Other ................................................................................... — — —
Sub Total ¥ 34,704 ¥ 30,390 ¥ (4,314)
Total ¥234,624 ¥261,867 ¥ 27,242
Thousands of U.S. dollars
2011
Acquisition
cost
Carrying
amount
Unrealized gain
(loss)
Securities for which the carrying amount exceeds the
acquisition costs
Stocks ................................................................................. $ 826,369 $1,385,543 $559,173
Bonds ................................................................................. — — —
Other ................................................................................... 911,620 931,900 20,279
Sub Total $1,737,990 $2,317,443 $579,452
Securities for which the carrying amount does not exceed
the acquisition cost
Stocks ................................................................................. $ 321,543 $ 267,383 $ (54,159)
Bonds ................................................................................. 315,117 311,671 (3,445)
Other ................................................................................... — — —
Sub Total $ 636,660 $ 579,055 $ (57,605)
Total $2,374,650 $2,896,498 $521,847