Suzuki 2011 Annual Report Download - page 5
Download and view the complete annual report
Please find page 5 of the 2011 Suzuki annual report below. You can navigate through the pages in the report by either clicking on the pages listed below, or by using the keyword search tool below to find specific information within the annual report.-
 1
1 -
 2
2 -
 3
3 -
 4
4 -
 5
5 -
 6
6 -
 7
7 -
 8
8 -
 9
9 -
 10
10 -
 11
11 -
 12
12 -
 13
13 -
 14
14 -
 15
15 -
 16
16 -
17
-
18
-
19
-
20
-
21
-
22
-
23
-
24
-
25
-
26
-
27
-
28
-
29
-
30
-
31
-
32
-
33
-
34
-
35
-
36
-
37
-
38
-
39
-
40
-
41
-
42
-
43
-
44
-
45
-
46
-
47
-
48
-
49
-
50
-
51
-
52
-
53
-
54
-
55
-
56
-
57
-
58
-
59
 |
 |
4 SUZUKI MOTOR CORPORATION
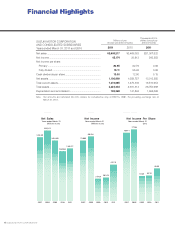
Financial Highlights
SUZUKI MOTOR CORPORATION
AND CONSOLIDATED SUBSIDIARIES
Years ended March 31, 2011 and 2010
Millions of yen
(except per share amounts)
Thousands of U.S.
dollars (except per
share amounts)
2011 2010 2011
Net sales ................................................................................ ¥2,608,217 ¥2,469,063 $31,367,622
Net income............................................................................. 45,174 28,913 543,283
Net income per share:
Primary ............................................................................... 80.65 62.76 0.96
Fully diluted ........................................................................ 74.11 55.26 0.89
Cash dividends per share ..................................................... 13.00 12.00 0.15
Net assets .............................................................................. 1,106,999 1,089,757 13,313,285
Total current assets ................................................................ 1,372,885 1,479,336 16,510,954
Total assets ............................................................................ 2,224,344 2,381,314 26,750,988
Depreciation and amortization .............................................. 138,368 141,846 1,664,088
Note: Yen amounts are translated into U.S. dollars, for convenience only, at ¥83.15= US$1, the prevailing exchange rate on
March 31, 2011.
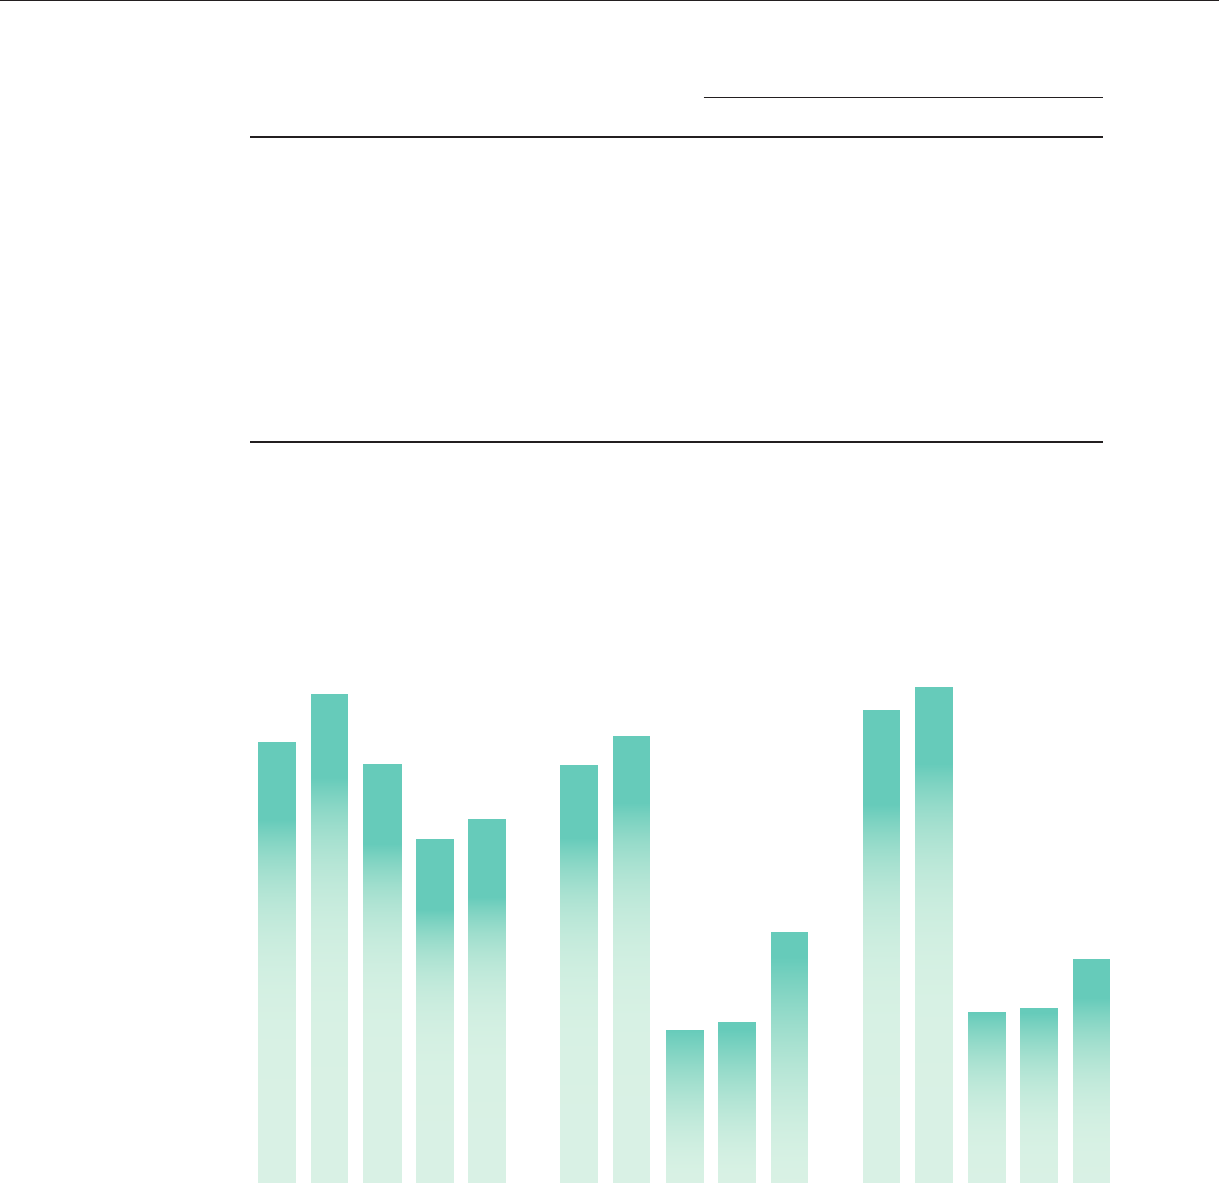
2010 2 011
Years ended March 31
(Millions of yen)
Net Sales
2,469,063
2,608,217
3,163,669
3,004,888
2007
3,502,419
Years ended March 31
(Millions of yen)
Net Income
2007
75,008
80,254
27,429
Years ended March 31
(yen)
Net Income Per Share
20072008 2009 2009
28,913
2010
45,174
2011 20092008 2008
169.41
177.96
61.68
2010
62.76
2011
80.65