Suzuki 2011 Annual Report Download - page 25
Download and view the complete annual report
Please find page 25 of the 2011 Suzuki annual report below. You can navigate through the pages in the report by either clicking on the pages listed below, or by using the keyword search tool below to find specific information within the annual report.-
 1
1 -
2
-
3
-
4
-
5
-
6
-
7
-
8
-
9
-
10
-
11
-
12
-
13
-
14
-
 15
15 -
 16
16 -
 17
17 -
 18
18 -
 19
19 -
 20
20 -
 21
21 -
 22
22 -
 23
23 -
 24
24 -
 25
25 -
 26
26 -
 27
27 -
 28
28 -
 29
29 -
 30
30 -
 31
31 -
 32
32 -
 33
33 -
 34
34 -
 35
35 -
36
-
37
-
38
-
39
-
40
-
41
-
42
-
43
-
44
-
45
-
46
-
47
-
48
-
49
-
50
-
51
-
52
-
53
-
54
-
55
-
56
-
57
-
58
-
59
 |
 |

24 SUZUKI MOTOR CORPORATION
Financial Review
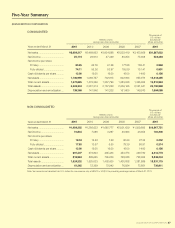
(3) Selling, general and administrative expenses
In this fiscal year, the amount of selling, general and administrative expenses increased by ¥6.9 billion to ¥514.8 billion be-
cause the sales promotion expenses increased due to the increased sales.
(4) Other income and expenses
In this fiscal year, the net amount of other income and expenses was a profit of ¥11.3 billion mainly due to financial account
balance and exchange gain. Compared to the previous fiscal year, profit decreased by ¥1.9 billion mainly due to an increase in
impairment loss and loss on valuation of securities
(5) Outlook of the next fiscal year
The outlook of the next fiscal year is as follows.
(Forecast of consolidated results)
Net sales ¥2,610.0 billion (up 0.1% y-o-y)
Operating income ¥110.0 billion (up 2.9% y-o-y)
Net income ¥50.0 billion (up 10.7% y-o-y)
Exchange rate 1 U.S. dollar = 80 yen, 1 Euro = 110 yen
* The business forecasts mentioned above are calculated based on currently available information and assumptions and
contain risks and uncertainty. Please note that the future results may greatly vary by the changes of various factors. Those
factors, which may influence the future results, include economic conditions and the trend of demand in major markets and
the fluctuations of foreign exchange rate (mainly Yen/U.S. dollar rate, Yen/Euro rate).
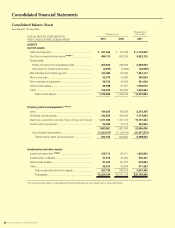
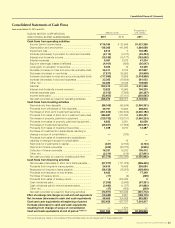
2. Liquidity and capital resources
(1) Cash flow
Cash flow from operating activities for this fiscal year increased by ¥226.5 billion (a fund increase of ¥326.4 billion for the
previous fiscal year), and the fund of ¥87.4 billion was mainly used for the acquisition of property, plant and equipment and invest-
ments in the investing activities (a fund decrease of ¥282.3 billion for the previous fiscal year). As a result, free cash flow increased
by ¥139.1 billion (a fund increase of ¥44.1 billion for the previous fiscal year). For the financing activities, the fund decreased by
¥75.0 billion mainly because of repayment of borrowings (a fund increase of ¥103.4 billion for the previous fiscal year).
As a result, the balance of cash and cash equivalents at the end of this fiscal year was ¥631.9 billion and up ¥48.5 billion from
the end of previous fiscal year.
(2) Demand for money
During this fiscal year, the Group invested a total ¥130.3 billion of capital expenditures for new model production, R&D invest-
ments, and so on. In the financing, ¥6.4 billion was secured by way of third-party allotment of new shares to Volkswagen AG in
June 2010, of which was mainly appropriated to capital expenditures for automobile R&D.
Capital expenditure project for the next fiscal year is ¥210.0 billion. The required fund will be covered mainly by our own funds.
3. Significant accounting policies
For information regarding significant accounting policies, please refer to the Notes to Consolidated Financial Statements.
* : An amount less than 100 million yen has been rounded off in “financial review” section.