Square Enix 2008 Annual Report Download - page 50
Download and view the complete annual report
Please find page 50 of the 2008 Square Enix annual report below. You can navigate through the pages in the report by either clicking on the pages listed below, or by using the keyword search tool below to find specific information within the annual report.-
 1
1 -
2
-
3
-
4
-
5
-
6
-
7
-
8
-
9
-
10
-
11
-
12
-
13
-
14
-
15
-
16
-
17
-
18
-
19
-
20
-
21
-
22
-
23
-
24
-
25
-
26
-
27
-
28
-
29
-
30
-
31
-
32
-
33
-
34
-
35
-
36
-
37
-
38
-
39
-
 40
40 -
 41
41 -
 42
42 -
 43
43 -
 44
44 -
 45
45 -
 46
46 -
 47
47 -
 48
48 -
 49
49 -
 50
50 -
 51
51 -
 52
52 -
 53
53 -
 54
54 -
 55
55 -
 56
56 -
 57
57 -
 58
58
 |
 |

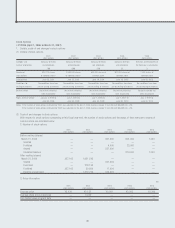
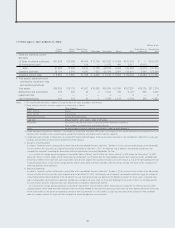
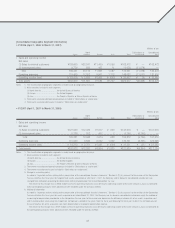
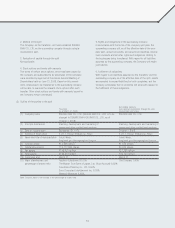
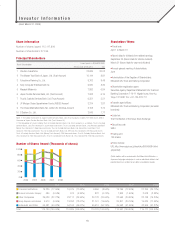
[Consolidated Overseas Sales]
• FY2006 (April 1, 2006 to March 31, 2007)
Millions of yen
North America Europe Asia Total
I Overseas sales ¥23,801 ¥12,271 ¥1,551 ¥ 37,624
II Consolidated sales — — — 163,472
III Overseas sales as a percentage of consolidated sales 14.6% 7.5% 1.0% 23.0%
Notes: 1. The classification of geographic segments is made based on geographical distance.
2. Main countries included in each segment:
(1) North America .......................... the United States of America, Canada
(2) Europe .................................... the United Kingdom, France, Germany, others
(3) Asia........................................ the People’s Republic of China, Republic of Korea, others
3. Overseas sales represent sales of the Company and its consolidated subsidiaries to countries and areas outside Japan.
• FY2007 (April 1, 2007 to March 31, 2008)
Millions of yen
North America Europe Asia Total
I Overseas sales ¥13,358 ¥7,896 ¥1,118 ¥ 22,373
II Consolidated sales — — — 147,516
III Overseas sales as a percentage of consolidated sales 9.1% 5.4% 0.8% 15.2%
Notes: 1. The classification of geographic segments is made based on geographical distance.
2. Main countries included in each segment:
(1) North America .......................... the United States of America, Canada
(2) Europe .................................... the United Kingdom, France, Germany, others
(3) Asia........................................ the People’s Republic of China, Republic of Korea, others
3. Overseas sales represent sales of the Company and its consolidated subsidiaries to countries and areas outside Japan.
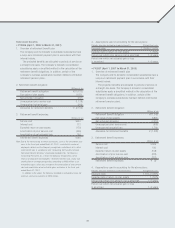
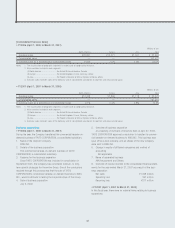
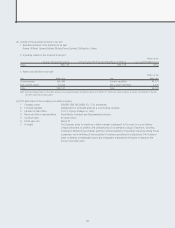
Business separations
• FY2006 (April 1, 2006 to March 31, 2007)
During the year, the Company transferred the commercial karaoke-on-
demand business of TAITO CORPORATION, a consolidated subsidiary.
1. Name of the recipient company
XING INC.
2. Details of the business separation
The commercial karaoke-on-demand business of TAITO
CORPORATION, a consolidated subsidiary.
3. Reasons for the business separation
Since TAITO CORPORATION was included in consolidation in
September 2005, the Company has considered medium- to long-
term growth strategies for the entire Group. One of the conclusions
reached through this process was that the sale of TAITO
CORPORATION’s commercial karaoke-on-demand business to XING
INC., would contribute to raising the corporate value of the Group.
4. Date of business separation
July 3, 2006
5. Overview of business separation
At a meeting of its Board of Directors held on April 27, 2006,
TAITO CORPORATION approved a resolution to transfer its commer-
cial karaoke-on-demand business to XING INC. This business was
spun off as a new company, and all shares of the new company
were sold to XING INC.
6. Change in equity of affiliated companies and method of
accounting
Not applicable
7. Name of separated business
AM (Amusement) and Others
8. Overview of losses recorded in the consolidated financial state-
ments for the year ended March 31, 2007 as a result of the busi-
ness separation:
Net sales ¥1,248 million
Operating loss ¥97 million
Recurring loss ¥217 million
• FY2007 (April 1, 2007 to March 31, 2008)
In this fiscal year, there were no material items relating to business
separations.
48