Square Enix 2008 Annual Report Download - page 38
Download and view the complete annual report
Please find page 38 of the 2008 Square Enix annual report below. You can navigate through the pages in the report by either clicking on the pages listed below, or by using the keyword search tool below to find specific information within the annual report.-
 1
1 -
2
-
3
-
4
-
5
-
6
-
7
-
8
-
9
-
10
-
11
-
12
-
13
-
14
-
15
-
16
-
17
-
18
-
19
-
20
-
21
-
22
-
23
-
24
-
25
-
26
-
27
-
 28
28 -
 29
29 -
 30
30 -
 31
31 -
 32
32 -
 33
33 -
 34
34 -
 35
35 -
 36
36 -
 37
37 -
 38
38 -
 39
39 -
 40
40 -
 41
41 -
 42
42 -
 43
43 -
 44
44 -
 45
45 -
 46
46 -
 47
47 -
 48
48 -
49
-
50
-
51
-
52
-
53
-
54
-
55
-
56
-
57
-
58
 |
 |

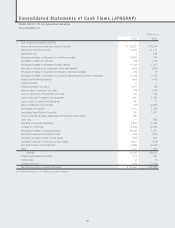
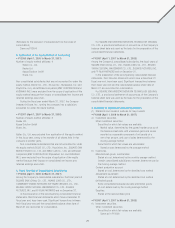
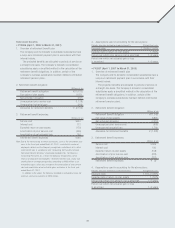
Notes to Consolidated Statements of Cash Flows
• FY2006 (April 1, 2006 to March 31, 2007)
*1 A reconciliation of cash and cash equivalents in the consoli-
dated statement of cash flows to the corresponding amount
disclosed in the consolidated balance sheet is as follows:
(As of March 31, 2007)
Cash and deposits ¥99,852 million
Time deposits with maturity
periods over three months (5 million)
Cash and cash equivalents ¥99,847 million
*2 Breakdown of key assets and liabilities resulting from the
transfer of a business.
The following figures represent reductions in key assets and
liabilities as a result of the transfer of the karaoke business of a
consolidated subsidiary, TAITO CORPORATION:
Current assets ¥ 552 million
Non-current assets 1,879 million
Total assets ¥2,431 million
Current liabilities ¥ 614 million
Total liabilities ¥ 614 million
• FY2007 (April 1, 2007 to March 31, 2008)
*1 A reconciliation of cash and cash equivalents in the consoli-
dated statement of cash flows to the corresponding amount
disclosed in the consolidated balance sheet is as follows:
(As of March 31, 2008)
Cash and deposits ¥111,515 million
Time deposits with maturity
periods over three months (36 million)
Cash and cash equivalents ¥111,479 million
*2 Not applicable
*3 Important non-cash transactions
The Company had the following important non-cash transactions:
Increase in common stock due to
conversion of convertible bonds ¥ 6,499 million
Increase in capital surplus due to
conversion of convertible bonds 6,499 million
Total ¥12,999 million
Decrease in convertible bonds due to
their conversion ¥13,000 million
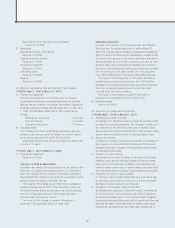
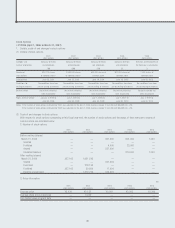
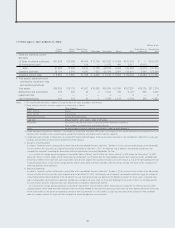
Lease Transactions
• FY2006 (April 1, 2006 to March 31, 2007)
Information related to finance leases other than those that transfer
ownership to the lessee
1. Acquisition cost, accumulated depreciation and net book value
of leased assets:
Millions of yen
Acquisition Accumulated Net book
cost depreciation value
Buildings and structures ¥ 238 ¥ 73 ¥ 165
Tools and fixtures 2,182 811 1,371
Total ¥2,420 ¥884 ¥1,536
Note: The total amount of future lease payments at the end of the year constituted
an insignificant portion of net property and equipment at the end of the year.
Accordingly, total acquisition cost included the interest portion thereon.
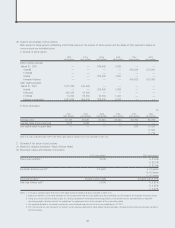
2. Ending balances of future lease payments:
Due within one year ¥ 451 million
Due after one year 1,084 million
Total ¥1,536 million
Note: The total future lease payments at the end of the year constituted an
insignificant portion of total property and equipment at the end of the year.
Accordingly, total future lease payments included the interest portion thereon.
3. Lease payments and depreciation expense:
Lease payments ¥499 million
Depreciation expense 499 million
4. Method of calculation for depreciation
Depreciation is calculated using the straight-line method over a
useful life with no residual value.
Operating lease transactions
Not applicable
(Impairment loss)
No impairment loss was recognized on leased assets.
36